
Apr 06, 2026
Weekly Index Highlights, April, 4, 2026
Market Performance Update
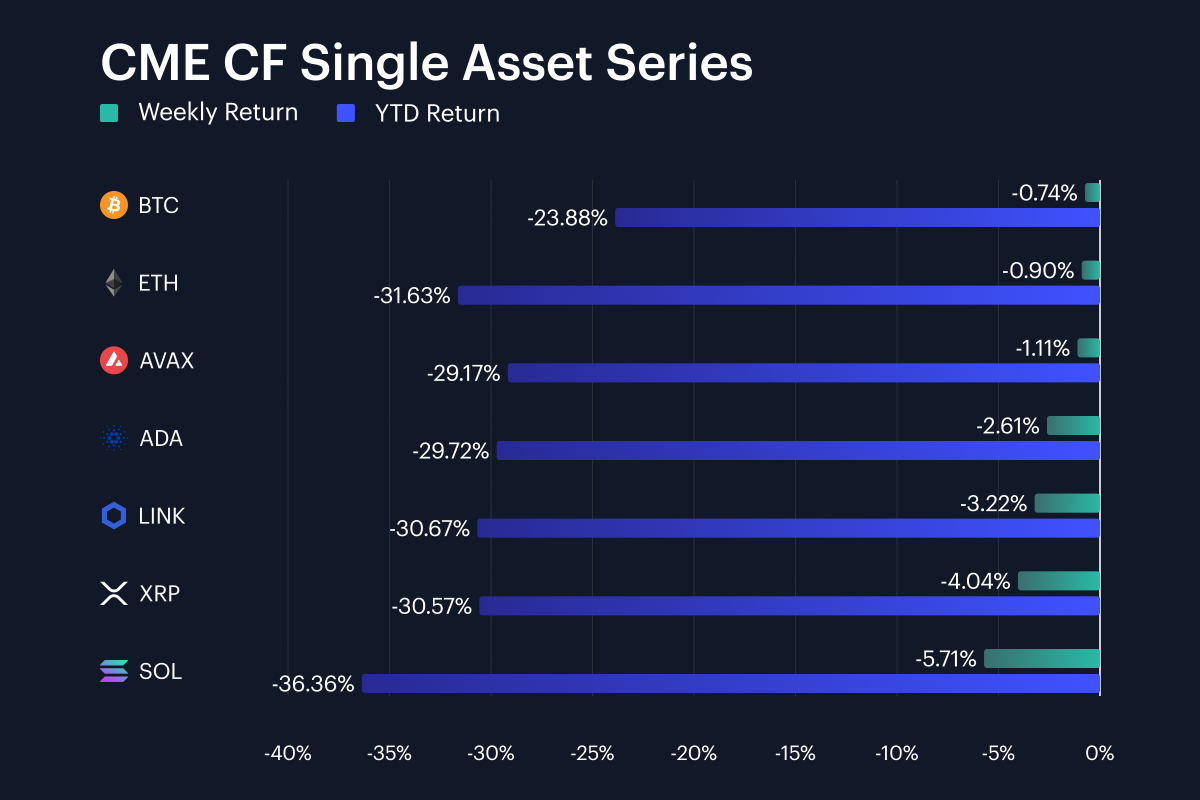
Digital assets posted a notably calmer week, with losses across the single-asset basket compressing sharply relative to the prior period. Bitcoin declined just 0.7% week-on-week (w/w) through Sunday, April 5th, a marked deceleration from the 6.2% drop the week before, bringing its year-to-date (YTD) loss to 23.9%. Ether fell 0.9% w/w, trimming its YTD drawdown to 31.6%. Solana remained the weakest major name at -5.7% w/w and -36.4% YTD, though even that represents an improvement from last week’s 10.1% decline. The single-asset basket spanned -0.7% to -5.7% on the week, a 5.0% range that is wider than last week’s 3.9% spread, driven primarily by SOL’s continued underperformance.
Volatility Analysis
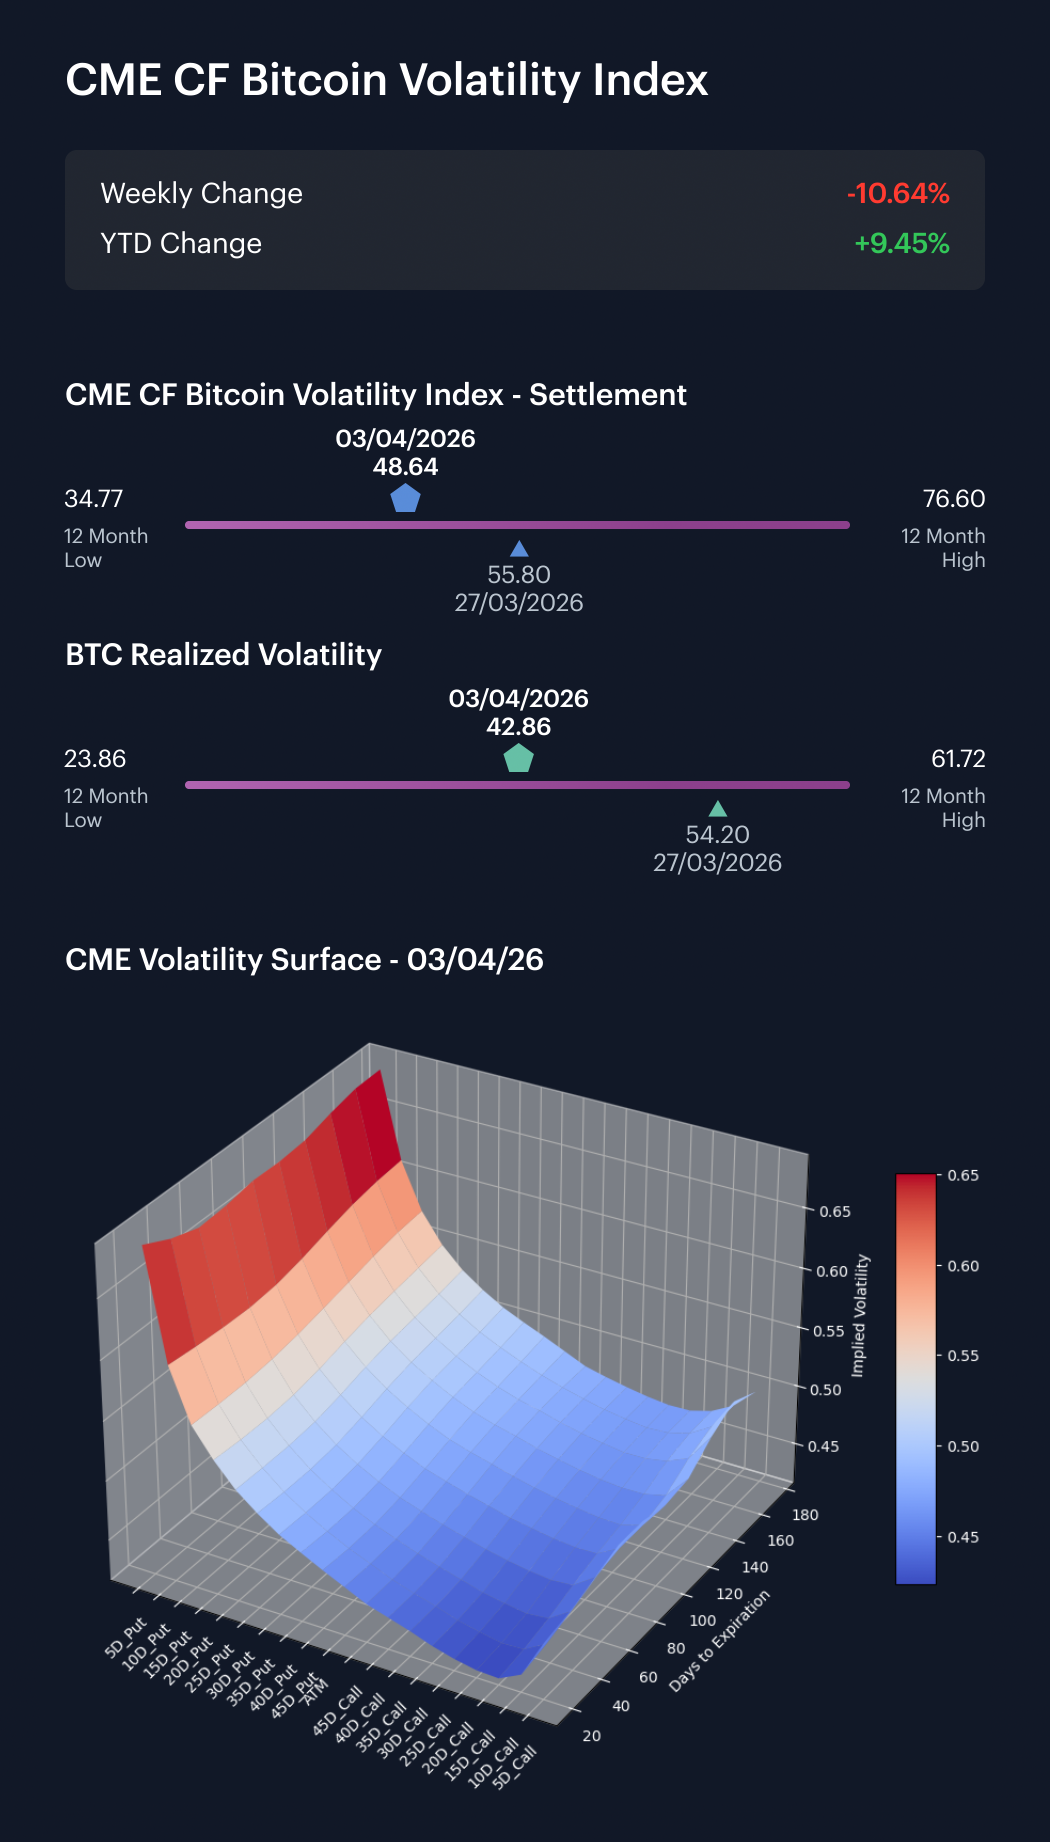
Bitcoin volatility declined sharply in both implied and realized terms, marking a clear break from the elevated regime of recent weeks. The CME CF Bitcoin Volatility Index Settlement Rate (BVXS) closed Thursday, April 3rd at 48.64, down 7.16 vol. points from 55.80 the previous Friday, a 10.64% week-on-week decline. Realized volatility fell even more steeply, dropping from 54.20 to 42.86, an 11.34 vol. point decline. The implied premium over realized widened to 5.78 points, up from 1.60 points last week, a configuration that typically signals the options market pricing in a meaningful risk of a near-term directional move even as spot markets have calmed. Year-to-date, BVXS remains 9.5% above the January 2nd level of 44.44, though it has now pulled back meaningfully from the recent highs. The 12-month range for BVXS stands at 34.77 to 76.60, placing the current reading back in the middle of the range for the first time in several weeks. The simultaneous drop in both measures suggests the prior weeks’ volatility impulse is fading, though the widening implied-realized gap warrants attention as a potential leading indicator.
Market Cap Index Performance
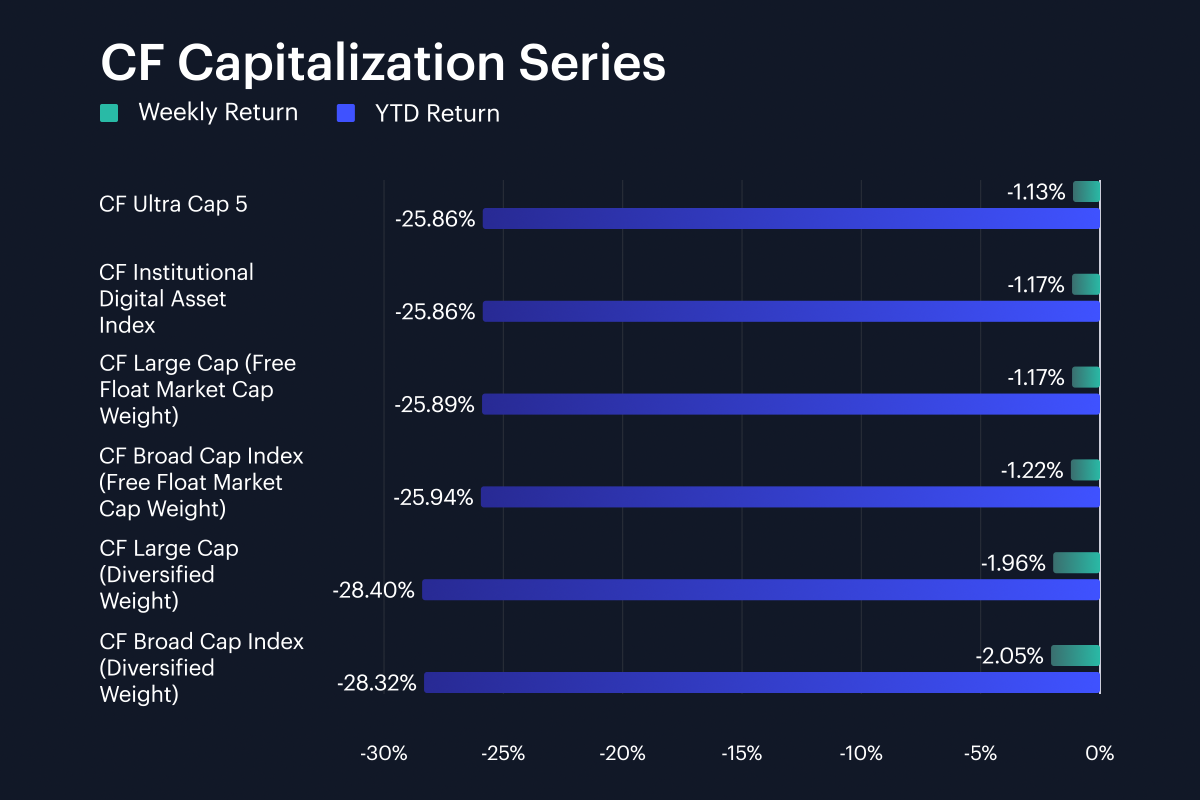
Market-cap indices posted modest losses, with the overall magnitude compressing substantially from the prior week’s -6.7% to -7.4% range. CF Ultra Cap 5 fell 1.1% w/w for a -25.9% YTD return, while the CF Large Cap and Broad Cap indices (Free Float Market Cap Weight) both declined approximately 1.2% w/w. Diversified-weight variants lagged once more: the CF Large Cap (Diversified Weight) lost 2.0% w/w, and the CF Broad Cap (Diversified Weight) also fell 2.0%, underperforming their free-float counterparts by roughly 0.8% each. The structural pattern of diversified-weight underperformance persists, though the gap narrowed from the prior week, consistent with the broader deceleration in selling pressure.
Factor Analysis
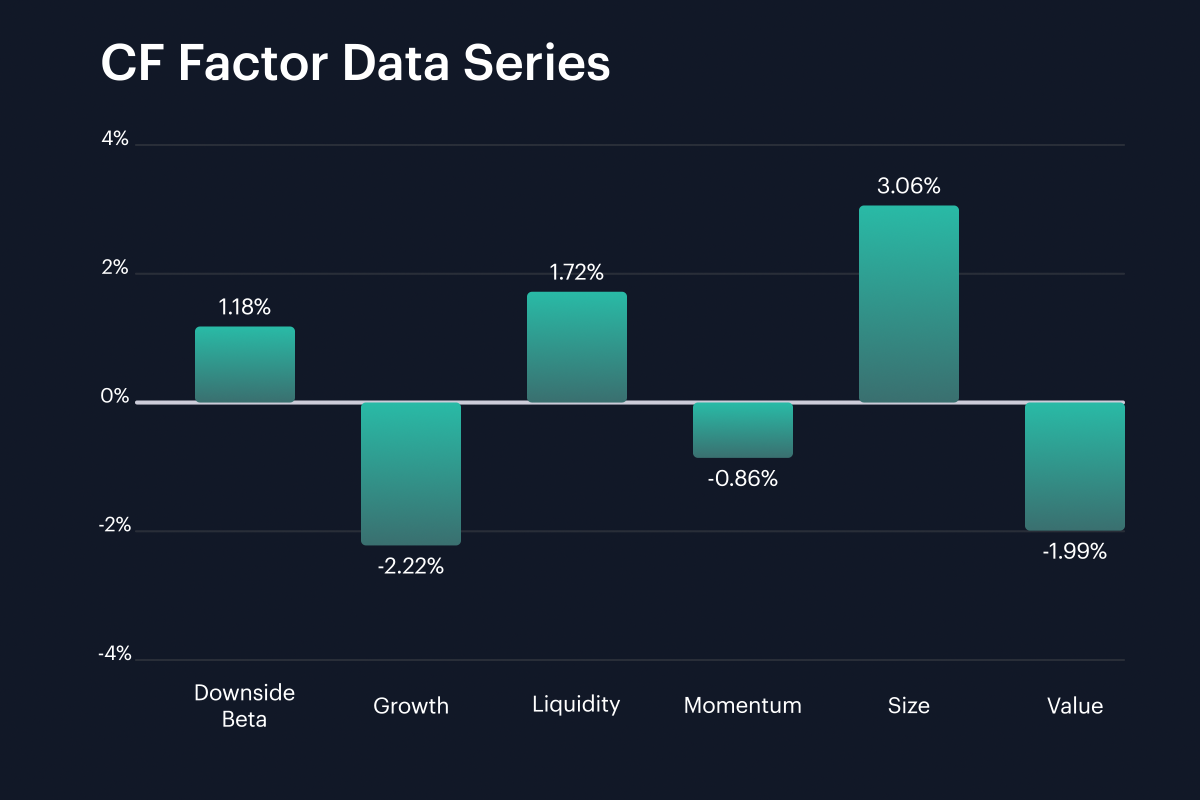
Factor returns rotated significantly this week, with the prior week’s defensive positioning partially unwinding. Size posted +3.06%, a sharp reversal from -1.19% previously and the largest single-factor swing at 4.25%. Liquidity also flipped positive at +1.72%, a 2.50% improvement from -0.78% the prior week. Downside Beta turned positive at +1.18%, implying the defensive bid that had characterized recent weeks loosened considerably. On the other side, Growth was the weakest factor at -2.22%, deteriorating from -0.32%, while Value printed -1.99% and Momentum reversed to -0.86%. The profile is a near-mirror image of last week: Size and Liquidity leading while Growth and Value lag point to a risk-on rotation into smaller, less liquid names and away from the growth-at-any-price trade that had been rewarded in the sell-off.
Classification Series Analysis
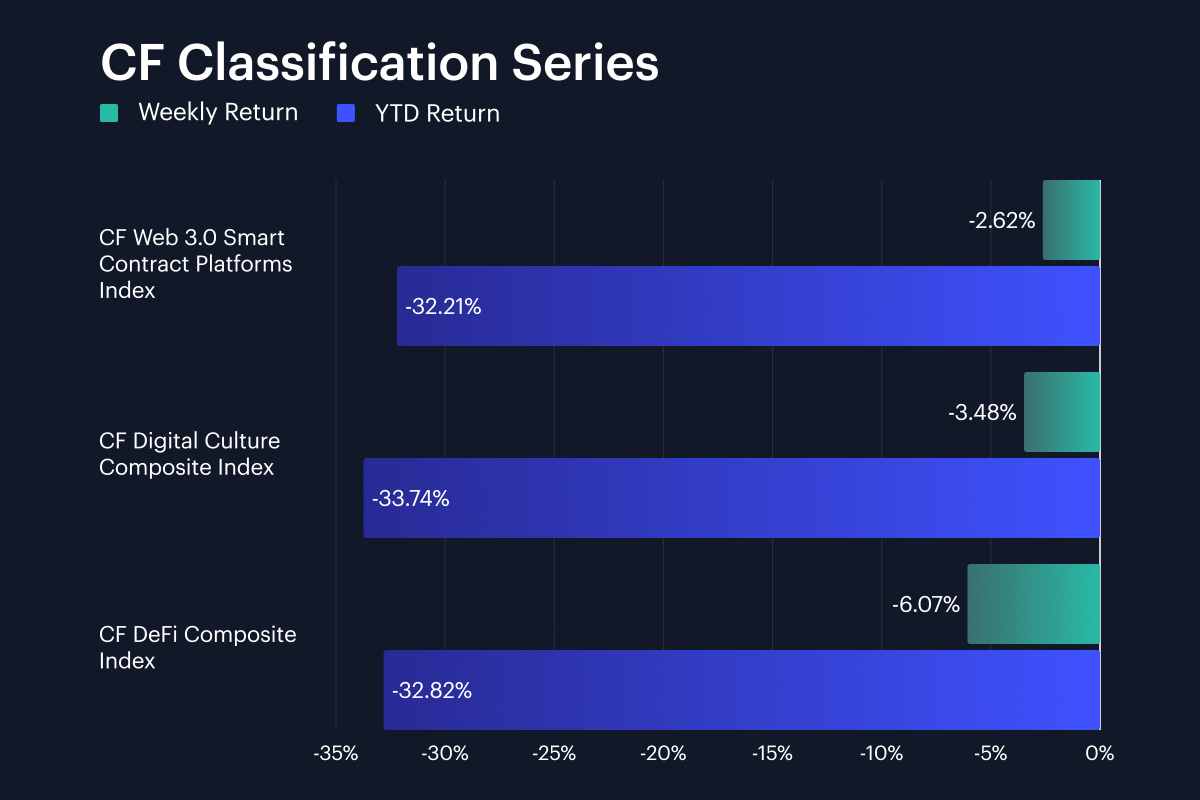
Within the CF Classification Series, the pace of losses moderated across all three thematic baskets, though the spread between best and worst widened. The CF Web 3.0 Smart Contract Platforms Index was the relative outperformer, falling just 2.6% w/w, a notable improvement from last week’s 8.8% decline, for a YTD return of -32.2%. The CF Digital Culture Composite Index lost 3.5% w/w, bringing its YTD drawdown to -33.7%, while the CF DeFi Composite Index was the weakest at -6.1% w/w and -32.8% YTD. The spread between best and worst weekly performers widened to 3.5%, compared with last week’s 1.4% gap, driven primarily by DeFi’s relative weakness. Web 3.0’s rotation from worst performer last week to best this week is the most notable shift in the complex, consistent with the broader rotation into smaller-cap and more liquid names flagged in the factor analysis. DeFi’s continued underperformance may reflect selling pressure in lending and trading protocols, where the Finance sub-sector averaged -7.3% on the week.
Sector Analysis
Sector performance across the CF Digital Asset Classification Structure (CF DACS) was mixed this week, with two of the six major Sub-Categories posting positive average returns for the first time in several weeks. Utility was the strongest at +0.7%, led by BICO’s 10.4% gain and ANKR’s 3.6% rise in the SDK & Tooling sub-sector, a reversal from last week’s position as the weakest Sub-Category. Programmable averaged +0.6%, with ALGO posting a remarkable 42.6% weekly gain that dominated the average; excluding ALGO, the Programmable Sub-Category would have been modestly negative. Culture averaged -3.5%, while Infrastructure posted -3.7%, with RENDER’s 7.4% gain providing the lone bright spot in Computing against broader weakness. Non-Programmable averaged -4.2%, and Finance was the weakest at -7.3%, dragged lower by LRC at -19.2% and KNC at -16.0% in the Trading sub-sector. The spread between best and worst Sub-Categories was 8.0%, wider than last week’s 5.8% range, as the return of positive readings in Utility and Programmable expanded the distribution. ALGO’s 42.6% rally was the standout idiosyncratic move, producing a constituent range from ALGO at +42.6% to LRC at -19.2%, a 61.8% span that dwarfs last week’s 23.8% range.
CF Staking Series
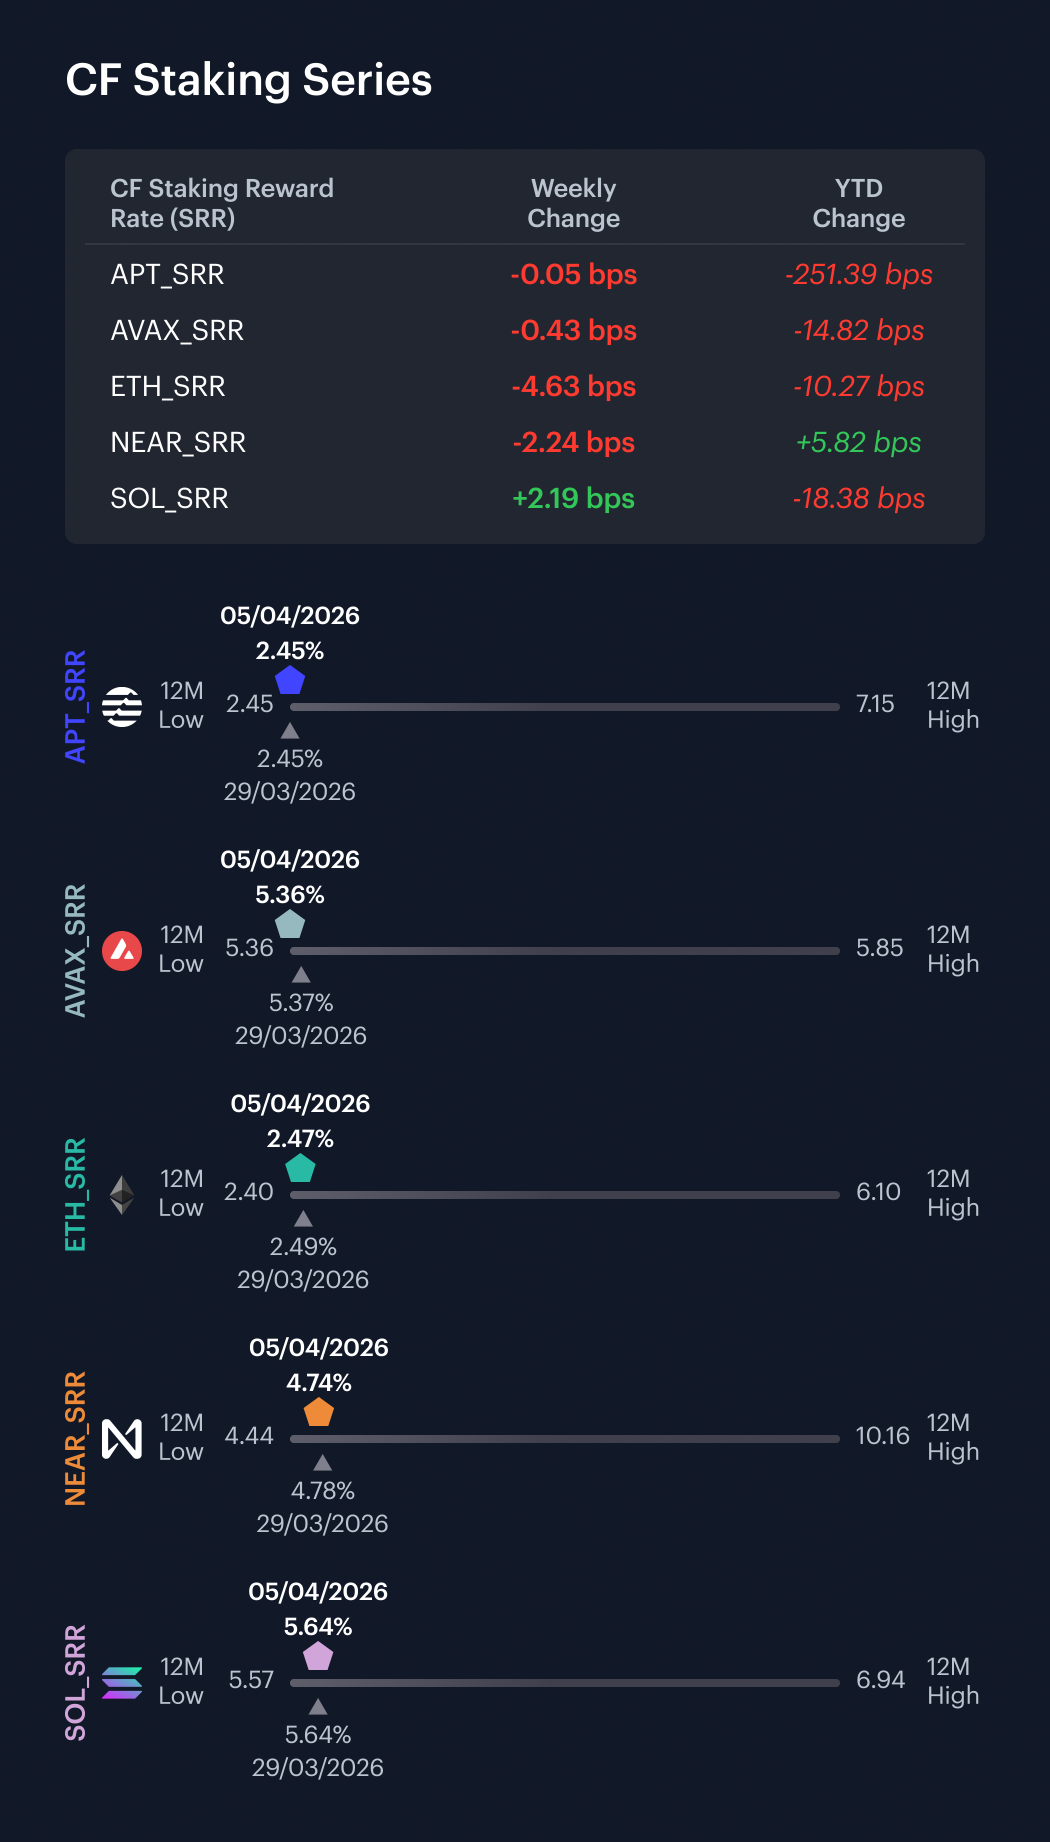
Within the CF Staking Series, conditions remained subdued for a second consecutive week following the prior period’s APT-driven dislocation. APT Staking was essentially flat at -0.02% w/w, with its reward rate decreasing by 0.05 bps to 2.45%, consistent with the stabilization observed after last week’s post-reset normalization. AVAX Staking posted -0.08% w/w, with a decrease of 0.43 bps in its reward rate. ETH Staking returned -1.84% on the week, a significant moderation from last week’s -19.14%, with its reward rate decreasing 4.63 bps from 2.51% to 2.47%. NEAR Staking returned -0.47% w/w, reversing last week’s increase, with its reward rate decreasing 2.24 bps. SOL Staking was the only name to post an increase at +0.39% w/w, with its reward rate increasing 2.19 bps to 5.64%. Across the complex, reward rate movements ranged from -4.63 bps (ETH) to +2.19 bps (SOL), a tighter band than the prior week, consistent with a normalization in yield conditions.
Interest Rate Analysis
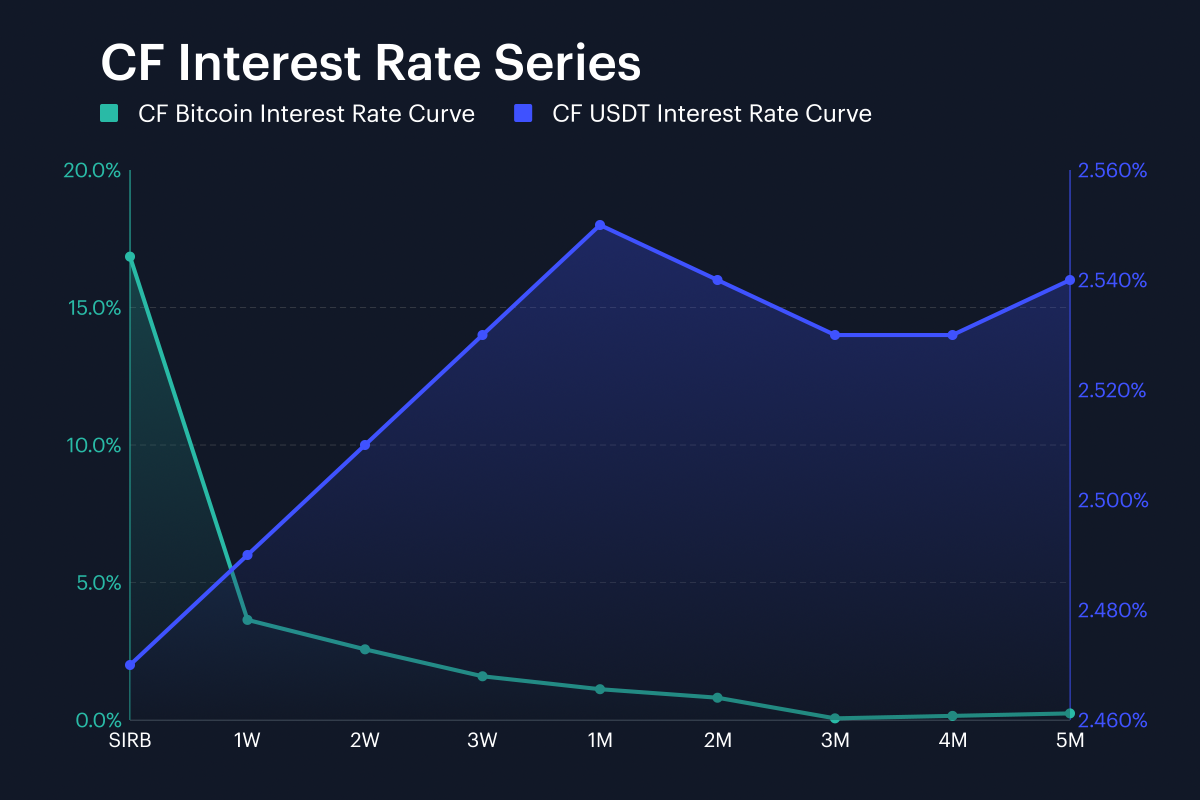
Across our CF BIRC curves, Bitcoin funding conditions displayed further front-end steepening this week, with the session rate surging to new heights while longer tenors remained contained. The Session Interest Rate for Bitcoin (SIRB) jumped from 12.66% at the end of the prior week to 16.85%, an increase of 419 bps that builds on the prior week’s 213 bps rise. The BTC 1W rate edged higher from 3.41% to 3.64%, up 23 bps, a more modest move than the session rate’s leap. BTC 3M fell from 0.10% to 0.06%, down 4 bps, leaving the front-end gap between 1W and 3M at 3.58%, a further widening from last week’s 3.31% spread. BTC 2M rose from 0.55% to 0.81%, up 26 bps, representing one of the few tenors to move higher beyond the very short end. The term structure thus maintained its heavily inverted shape, with the kink between overnight/session rates and the rest of the curve becoming increasingly pronounced. In USDT funding, the session rate was largely unchanged at 2.47% (versus 2.46%), with the 1W rate at 2.49% and 3M at 2.53%, implying continued flatness. The widening gap between BTC and USDT session rates, now over 14%, is the most extreme reading in recent weeks and suggests that leveraged BTC-specific demand for short-dated funding continues to intensify even as spot markets have stabilized.
The information contained within is for educational and informational purposes ONLY. It is not intended nor should it be considered an invitation or inducement to buy or sell any of the underlying instruments cited including but not limited to cryptoassets, financial instruments or any instruments that reference any index provided by CF Benchmarks Ltd. This communication is not intended to persuade or incite you to buy or sell security or securities noted within. Any commentary provided is the opinion of the author and should not be considered a personalised recommendation. Please contact your financial adviser or professional before making an investment decision.
Note: Some of the underlying instruments cited within this material may be restricted to certain customer categories in certain jurisdictions.
Changes to the Token Market Price Benchmarks Series - Market Prices – 21 July 2026
The Administrator has confirmed changes to the Token Market Price Family for the period 14 July 2026 to 21 July 2026.

CF Benchmarks
Softer CPI Reprices July Hike Risk & Lifts Digital Assets
Digital assets extended their recovery over the past week as cooler US inflation prints repriced Fed expectations; the bid was broad across the large cap indices, growth factor leadership returned, stablecoin funding repriced lower, and stress stayed isolated in names hit by token-specific news.
Mark Pilipczuk
Notice of the Demising of CF Dai-Dollar Settlement Price and Spot Rate
The Administrator announces that it will demise the CF Dai-Dollar Settlement Price (DAIUSD_RR) and CF Dai-Dollar Spot Rate (DAIUSD_RTI) which are members of the CF Digital Asset Index Family.
CF Benchmarks
By clicking Accept, you consent to CF Benchmarks's use of cookies.
Visit Cookie Settings to learn how CF Benchmarks uses cookies and to adjust your preferences.