
Apr 27, 2026
Weekly Index Highlights, April, 27, 2026
Market Performance Update
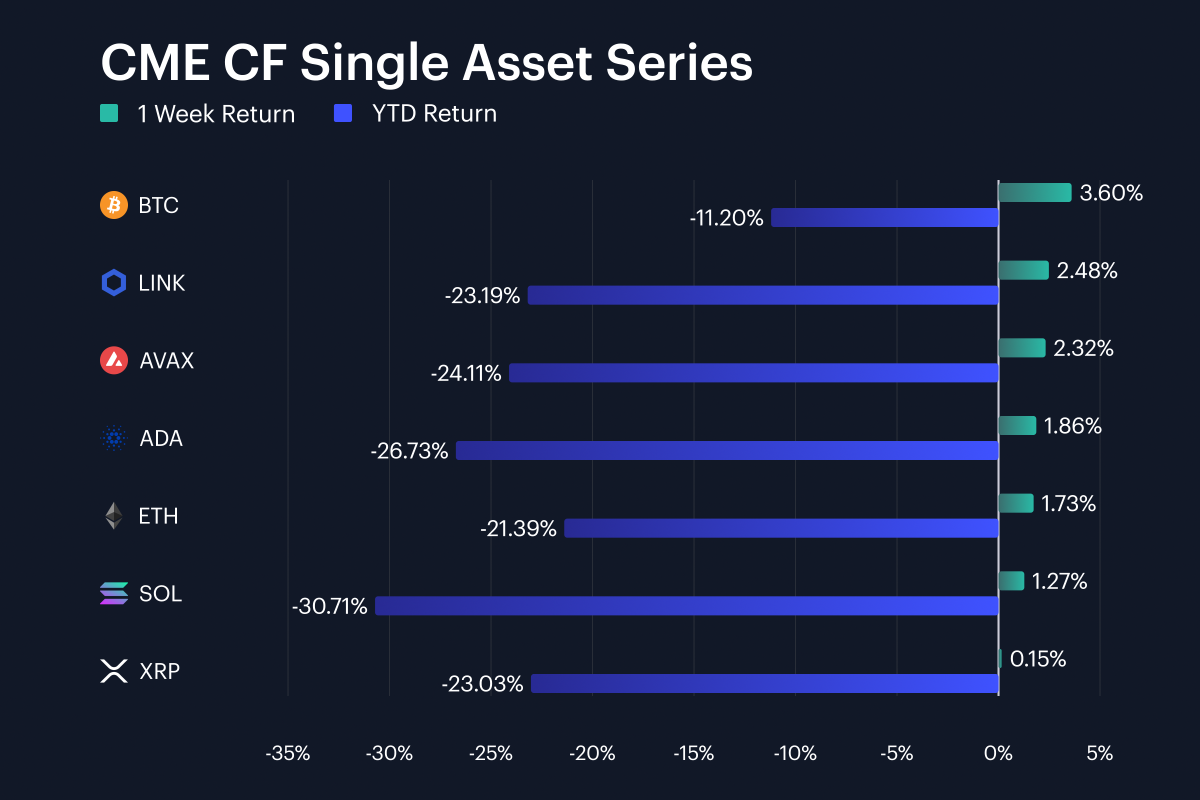
Digital assets have staged a second consecutive weekly advance though the gain was more compact than the prior week’s rally. Bitcoin rose 3.6% week-on-week (w/w), narrowing its negative year-to-date (YTD) return to -11.2%. Ether added 1.7% w/w to stand at -21.4% YTD. Chainlink led the single-asset set with a 2.5% weekly gain, followed by Avalanche at 2.3% and Cardano at 1.9%. Solana rose 1.3%, while XRP was nearly unchanged at 0.2%. The current weekly return band ran from +0.2% to +3.6%, compared with +1.0% to +7.4% in the prior week. So, the rebound narrowed by 2.95 percentage points (pp). YTD returns remained sharply negative at their worst end, ranging from Solana’s -30.7% to Bitcoin’s -11.2%, keeping the 2026 drawdown profile intact, despite the week’s positive tape. The gap between Chainlink’s 2.5% gain and XRP’s 0.2% return was 2.33 pp, which kept dispersion visible even inside a uniformly positive week.
Volatility Analysis
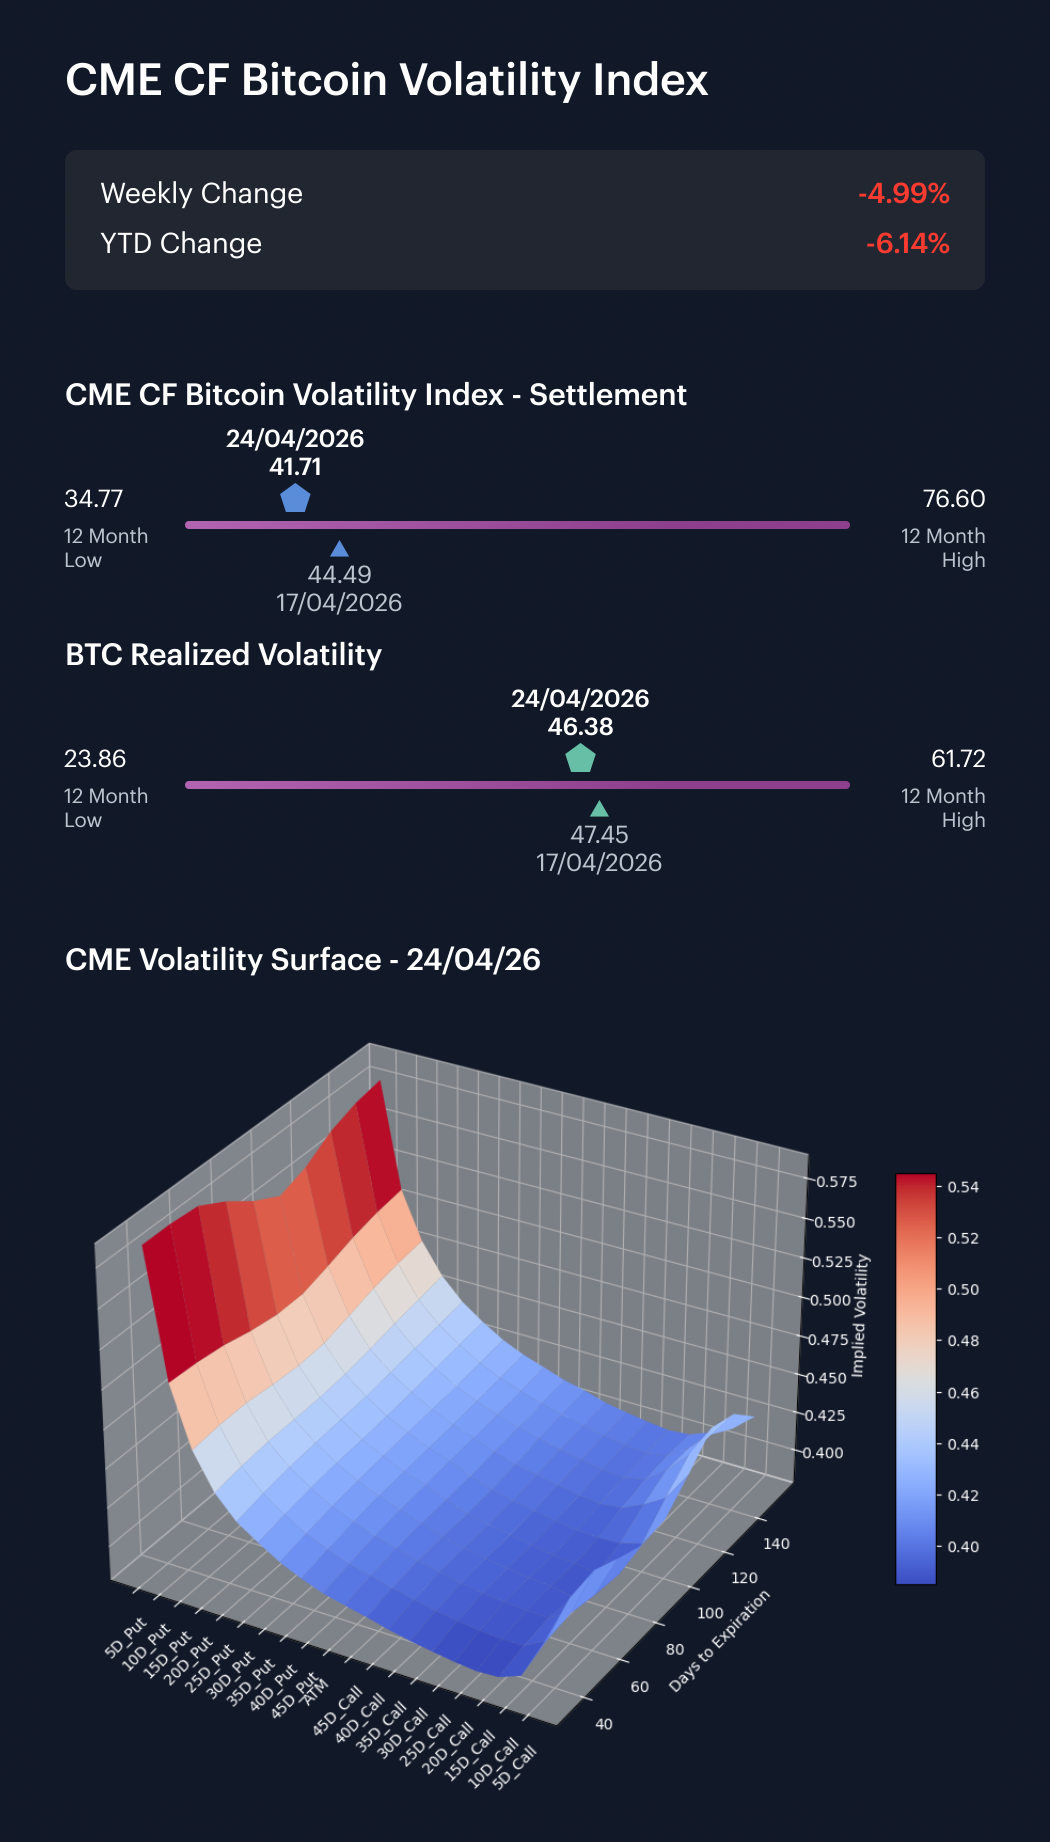
Bitcoin volatility softened in implied terms over the business week from April 20th to April 24th. The CME CF Bitcoin Volatility Index - Settlement (BVXS) moved from 44.49 on the previous Friday, to 41.71 by April 24th, a decline of approximately 2.78 vol. points. Realized volatility moved from 47.45 to 46.38, a smaller decline of 1.08 vol. points. Within the week, BVX opened at 43.90, before closing at its business week low of approximately 41.71. Realized volatility opened at 46.92, then drifted down to as low as 45.90, before closing somewhat above that at 46.38 by Friday April 24th. The implied-realized spread finished at -4.67 vol points, compared with -2.96 a week earlier, widening in realized volatility’s favor by 1.70 vol points. The 4.67 vol.-point realized premium leaves the spot market’s recent movement higher than the level priced by BVXS’s 30-day implied volatility indication. From Monday’s 43.90 open to Friday’s 41.71 close, implied volatility fell 2.19 vol points, while realized volatility fell 0.55 vol points over the same window. The realized-implied differential still appears to be a modest signal, at best.
Market Cap Index Performance
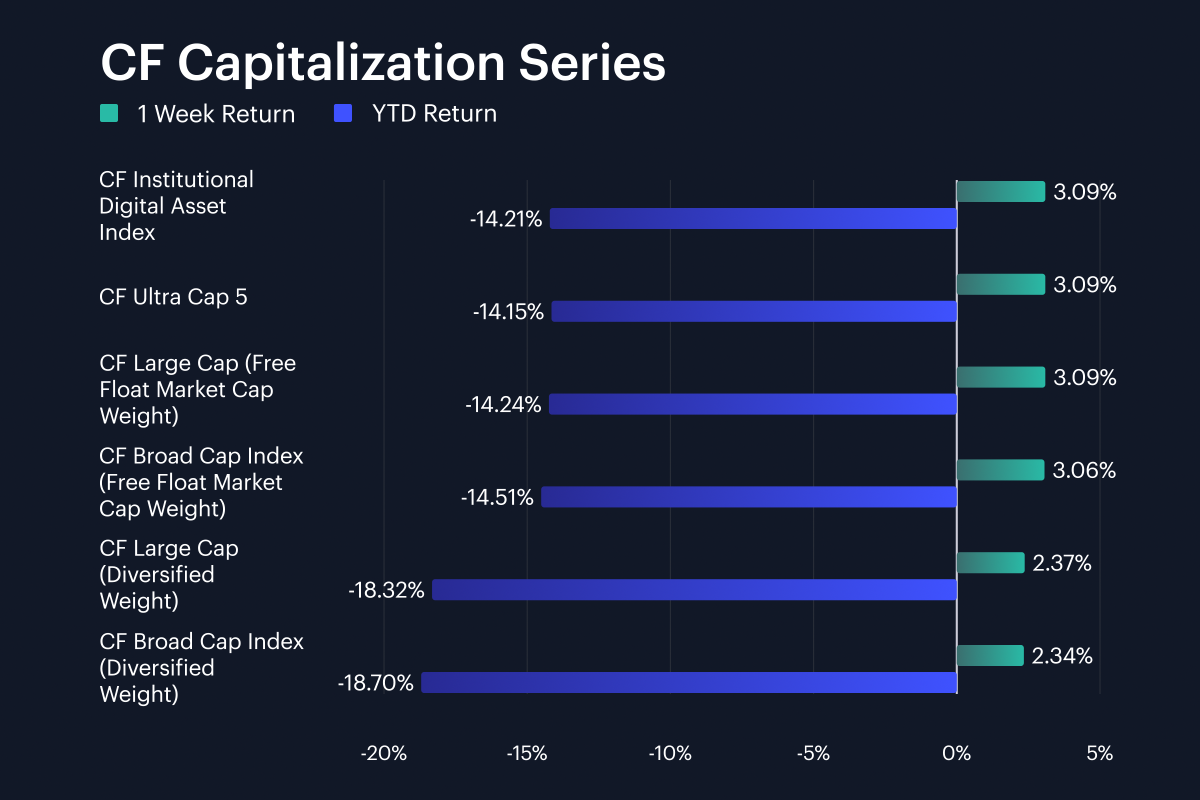
Capitalization indices were positive across all six series, with weekly rises clustered in a 2.3% to 3.1% range. The CF Large Cap (Free Float Market Cap Weight) index gained about 3.1% w/w, the CF Institutional Digital Asset Index also added circa 3.1%, and the CF Ultra Cap 5 advanced around 3.1% too. Likewise, the CF Broad Cap Index (Free Float Market Cap Weight) index printed an approximate 3.1% uplift (+3.06%) as well. Diversified-weight indices lagged by a perceptible margin: the CF Large Cap (Diversified Weight) rose 2.4%, while the CF Broad Cap Index (Diversified Weight) rose 2.3%. The spread between the strongest and weakest capitalization indices was 0.74 pp, placing free-float exposure ahead of diversified broad-cap exposure. That gap is still modest after the prior week’s 5.5% to 5.8% capitalization range, but the most recent week’s range continues to indicate a bias for the largest free-float-weighted assets. YTD returns across the capitalization set remained negative, from -18.7% to -14.2%, so the weekly advance merely trimmed 2026 losses.
Factor Analysis
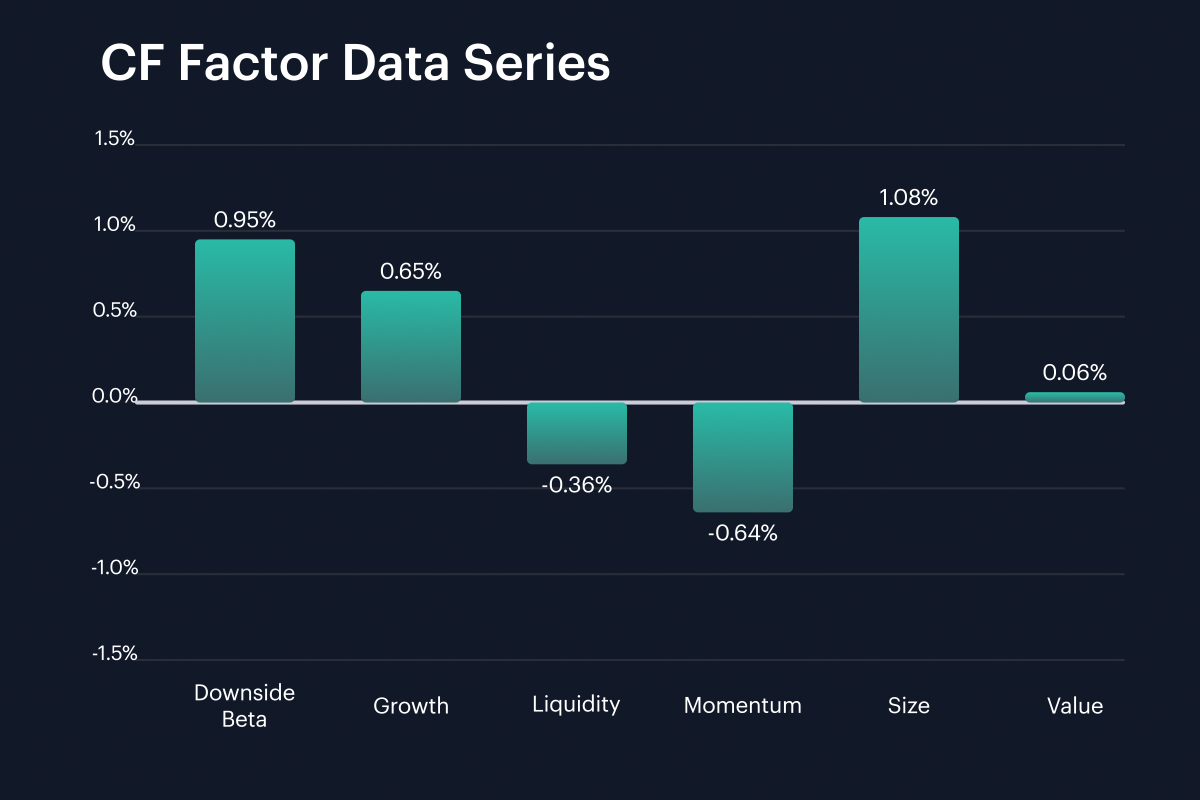
Factor returns split between positive Size and Downside Beta exposure and weaker Momentum and Liquidity exposure, with the full weekly range running from -0.6% to 1.1%. Size printed 1.1% for the week, up from 0.6% in the prior week, a move of 0.47 pp. Downside Beta moved from -0.5% to 0.9%, a 1.46 pp change. Growth remained positive at around 0.6%, although it eased by -0.50 pp from the prior week’s 1.1%. Value moved from -0.7% to 0.06%, a 0.72 pp improvement. Liquidity fell from 0.8% to -0.4%, and Momentum weakness widened slightly from -0.3% to -0.6%. The 1.72 pp gap between Size and Momentum points to larger names carrying the factor tape, while trend and liquidity exposures trailed. Four of the six factors were positive this week, with Size, Downside Beta, Growth, and Value above zero, and Liquidity and Momentum were below zero, at about -0.4% and -0.6%.
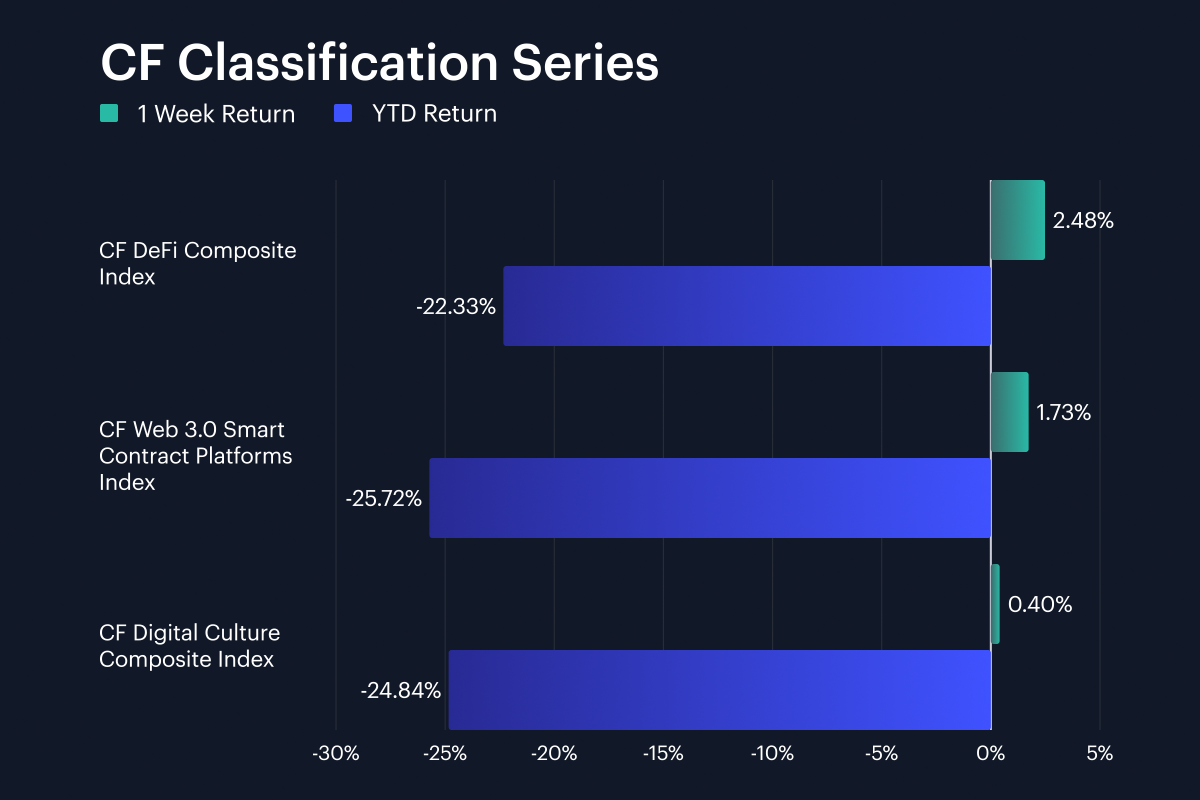
Classification Series Analysis
Across the CF Classification Series, the CF DeFi Composite Index led the three-theme group with a 2.5% weekly return, and the gauge led the series on a YTD basis too, as its decline for 2026, so far, narrowed to -22.3%. The CF Web 3.0 Smart Contract Platforms Index gained 1.7% w/w and remained down -25.7% YTD, while the CF Digital Culture Composite Index rose 0.4% w/w and stood at -24.8% YTD. DeFi outperformed Digital Culture by 2.08 pp and Web 3.0 platforms by 0.75 pp on the week. The current classification range of 0.4% to 2.5% was below the prior week’s 4.2% to 8.0% range, showing a slower second week of recovery. All three themes remained in drawdown for 2026, with YTD returns between -25.7% and -22.3%. The strongest recovery signal sat in DeFi’s 2.5% weekly gain, while Digital Culture’s 0.4% print showed only a marginal extension. DeFi’s weekly return slowed by -5.48 pp from the prior week, Web 3.0 slowed by -2.52 pp, and Digital Culture slowed by -5.15 pp.
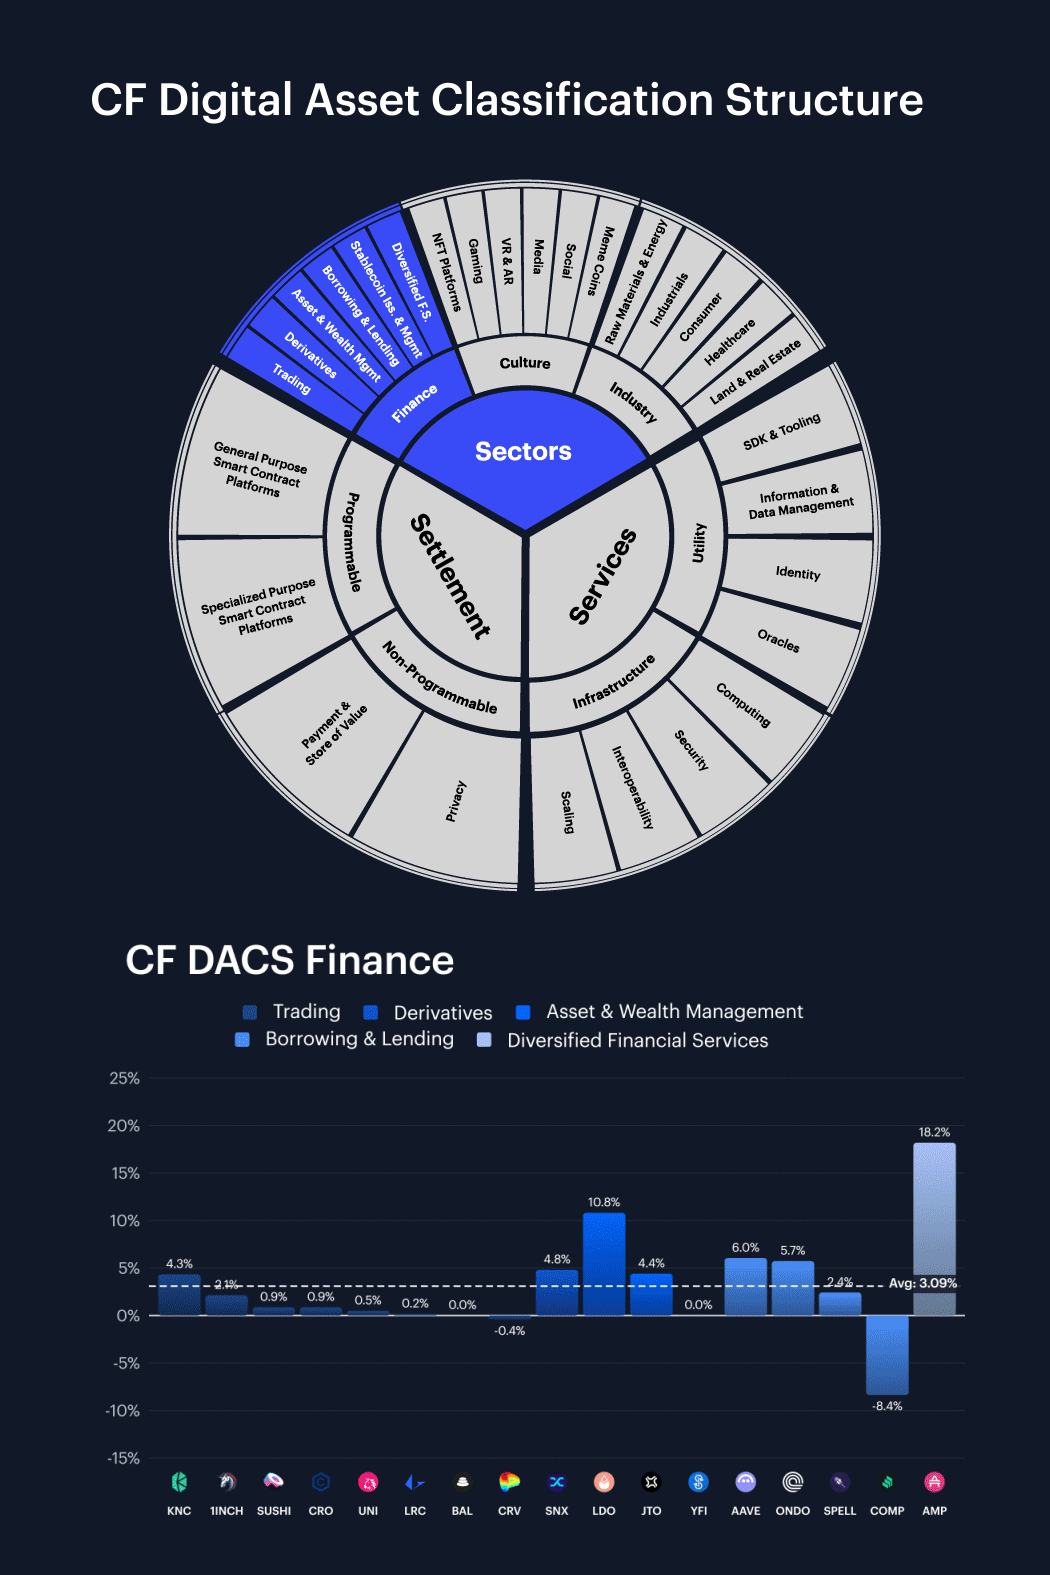
Sector Analysis
Sector performance was positive across our CF Digital Asset Classification Structure (CF DACS) universe, with average constituent returns spanning 0.8% to 6.5%. The Culture Sub-Category led at 6.5% on average, lifted by APE’s massive at 46.5% spike, AXS at +26.9%, and CHZ at +14.2%. Programmable Settlement was next best Sub-Category with an average +4.5%, supported by ALGO at +15.3%, ATOM at +13.4%, and SEI at +12.0%. Utility averaged 3.6%, while Finance averaged 3.1%; within Finance, AMP gained 18.2%, LDO gained 10.8%, and AAVE gained 6.0%. Non-Programmable Settlement averaged +1.7%, helped by Bitcoin’s 3.6% return. Infrastructure lagged at +0.8%, with STRK gaining 15.2%, but TIA falling -7.3% and QNT at -5.3%. The 5.75 pp gap between Culture and Infrastructure shows that high-beta social, gaming, and programmable settlement names drove the sector dispersion. Four of the six populated DACS blocks averaged above +3.0%, while Non-Programmable Settlement at +1.7% and Infrastructure at +0.8% sat below the +2.0% threshold, leaving dispersion broad.
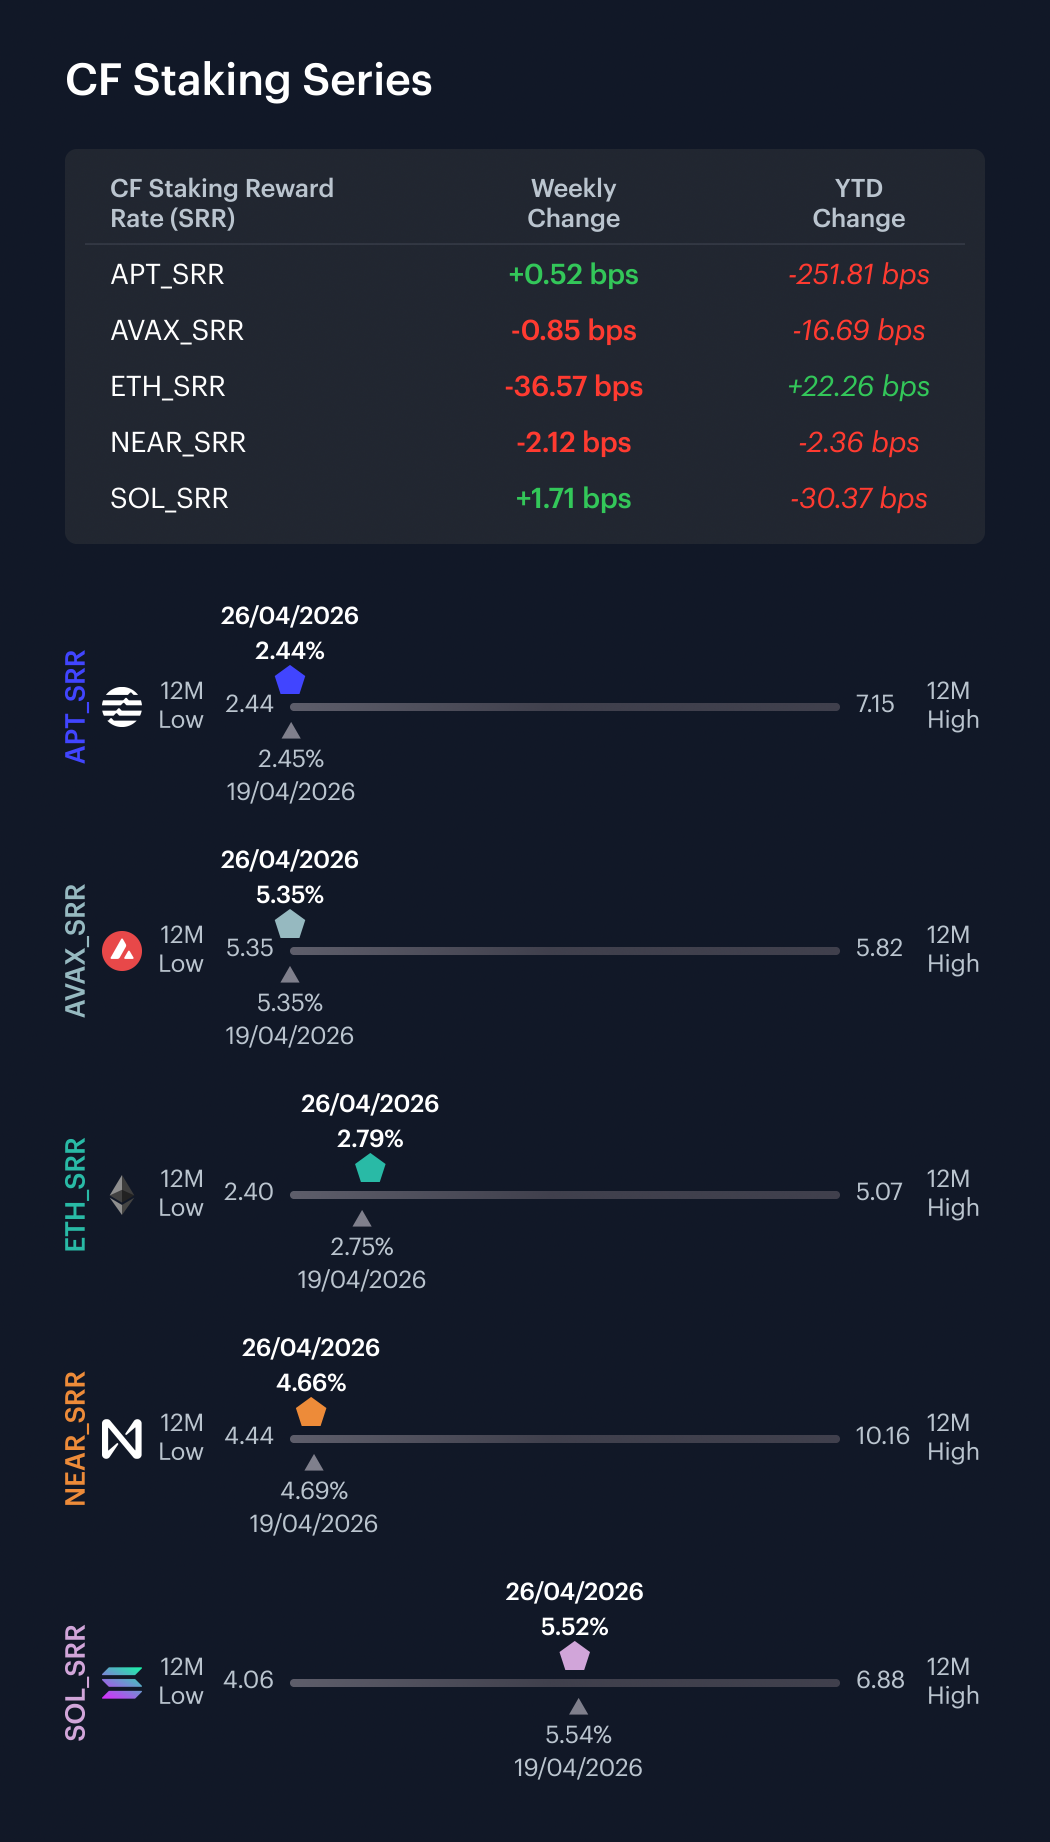
CF Staking Series
Across the CF Staking Series, reward-rate changes were mixed over the April 20th–26th window. ETH saw the sharpest decline, with its reward rate falling from 3.1568% to 2.7911%, a -36.6 bps move, or roughly an -11.6% relative change. APT and SOL posted modest increases, with reward rates rising 0.5 bps and 1.7 bps, respectively. AVAX and NEAR declined by 0.8 bps and 2.1 bps. Across the set, absolute reward-rate changes ranged from -36.6 bps to +1.7 bps, with ETH accounting for most of the downside.
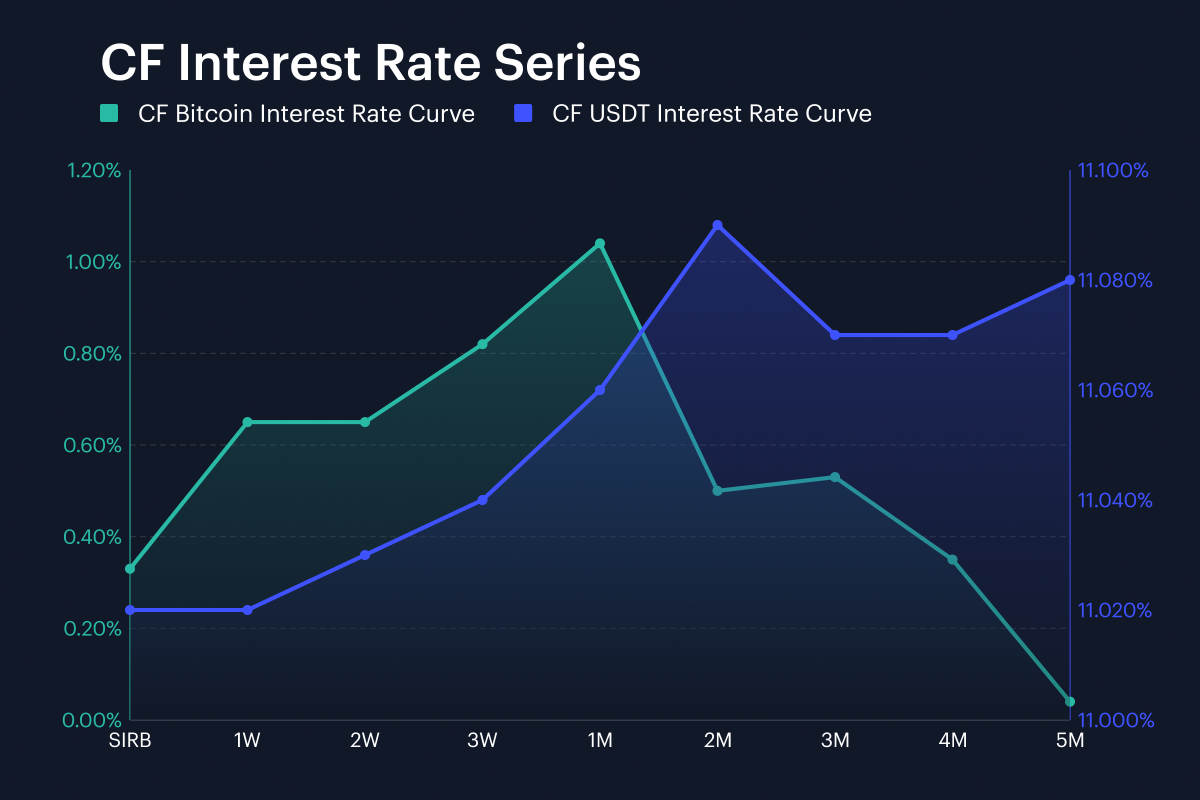
Interest Rate Analysis
Funding conditions diverged sharply across the CF BIRC curves, with BTC front-end rates falling by as much as 1198.3 bps and USDT rates rising by more than 668.4 bps. Bitcoin’s session rate (SIRB) moved from 12.31% to 0.33%, a change of -1198.3 bps, while BTC 1W moved from 2.43% to 0.65%, and BTC 3M moved from 0.23% to 0.53%. Those BTC 1W and 3M moves were -177.5 bps and 29.8 bps. USDT’s SIRB rose from 4.33% to 11.02%, a change of 668.4 bps. USDT 1W rose from 4.34% to 11.02%, and 3M moved from 4.37% to 11.07%. Across both curves, tenor-by-tenor changes ranged from -1198.3 bps to 670.2 bps. The end-state was a BTC curve depicting several short- to mid-term tenors below 1.0%, set against a USDT curve clustered around 11.0%. At the 1M point, BTC printed 1.04% and USDT printed 11.06%, a cross-curve spread of 1002.0 bps.
The information contained within is for educational and informational purposes ONLY. It is not intended nor should it be considered an invitation or inducement to buy or sell any of the underlying instruments cited including but not limited to cryptoassets, financial instruments or any instruments that reference any index provided by CF Benchmarks Ltd. This communication is not intended to persuade or incite you to buy or sell security or securities noted within. Any commentary provided is the opinion of the author and should not be considered a personalised recommendation. Please contact your financial adviser or professional before making an investment decision.
Note: Some of the underlying instruments cited within this material may be restricted to certain customer categories in certain jurisdictions.
Changes to the Token Market Price Benchmarks Series - Market Prices – 21 July 2026
The Administrator has confirmed changes to the Token Market Price Family for the period 14 July 2026 to 21 July 2026.

CF Benchmarks
Softer CPI Reprices July Hike Risk & Lifts Digital Assets
Digital assets extended their recovery over the past week as cooler US inflation prints repriced Fed expectations; the bid was broad across the large cap indices, growth factor leadership returned, stablecoin funding repriced lower, and stress stayed isolated in names hit by token-specific news.
Mark Pilipczuk
Notice of the Demising of CF Dai-Dollar Settlement Price and Spot Rate
The Administrator announces that it will demise the CF Dai-Dollar Settlement Price (DAIUSD_RR) and CF Dai-Dollar Spot Rate (DAIUSD_RTI) which are members of the CF Digital Asset Index Family.
CF Benchmarks
By clicking Accept, you consent to CF Benchmarks's use of cookies.
Visit Cookie Settings to learn how CF Benchmarks uses cookies and to adjust your preferences.