
Apr 22, 2025
Weekly Index Highlights, April 21, 2025
Market Performance Update
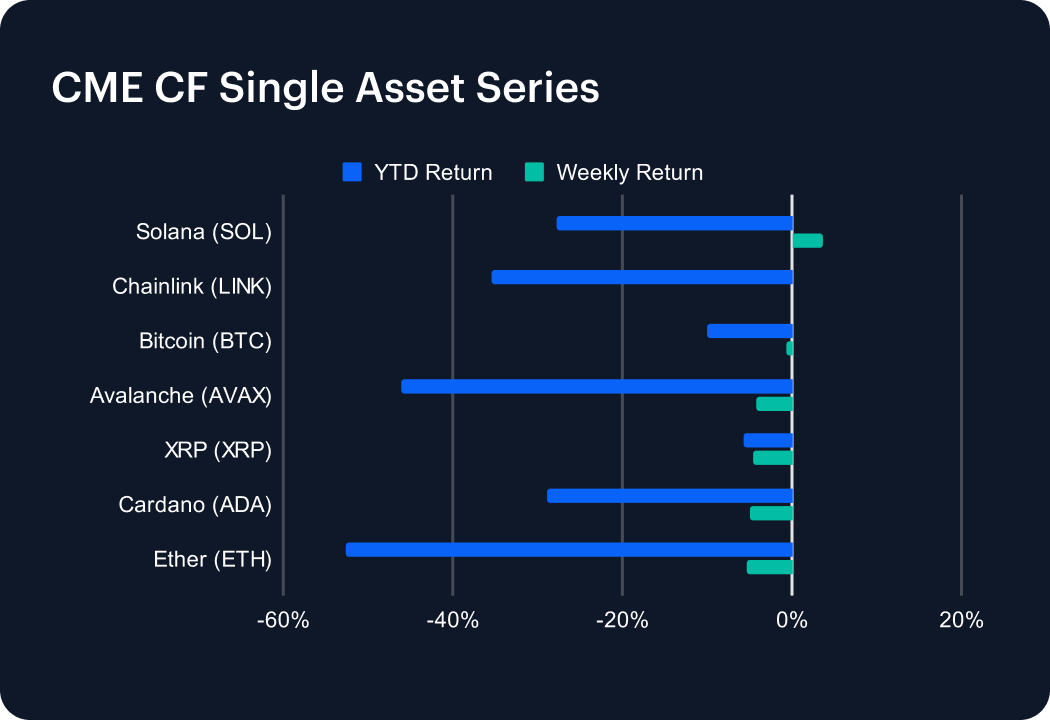
Recent gains from last week reversed as several major tokens slipped further into negative territory. Solana (SOL) edged up 3.64%, trimming its year-to-date (YTD) loss to -27.85% and emerging as a rare bright spot. Chainlink (LINK) held steady with a minimal 0.16% rise, now down -35.50% YTD. Bitcoin (BTC) dipped 0.60%, its YTD return settling at -10.05%. Avalanche (AVAX) slid 4.29%, deepening its YTD loss to -46.10%. XRP lost 4.50%, increasing its YTD decline to -5.76%, while Cardano (ADA) fell 5.01%, pushing its YTD return to -28.79%. Ether (ETH) remained the weakest performer, dropping 5.37% this week to extend its YTD slump to -52.64%.
Sector Analysis
Digital assets were mixed this week, with standout gains in select segments but broader weakness across key sub-categories. In Computing, FET surged 21.47% and RENDER added 9.51%, while JASMY (-10.12%) and HNT (-12.11%) weighed on the segment. SDK & Tooling showed strength with BICO (+8.95%) and ANKR (+7.89%). In the Culture sub-category, APE rose 7.46%, while PRIME dropped 10.83% in Social, and SUPER fell 7.42% in Gaming. Meme Coins struggled, with BONK (-8.81%) and DOGE (-6.03%) among the worst performers. Infrastructure tokens saw moderate gains, with OP up 5.02% and Identity token GAL gaining 2.28%. Notably, KNC stood out in Trading with a 10.18% weekly return, contrasting with broader declines across the Borrowing & Lending and Stablecoin segments.
Staking Metrics
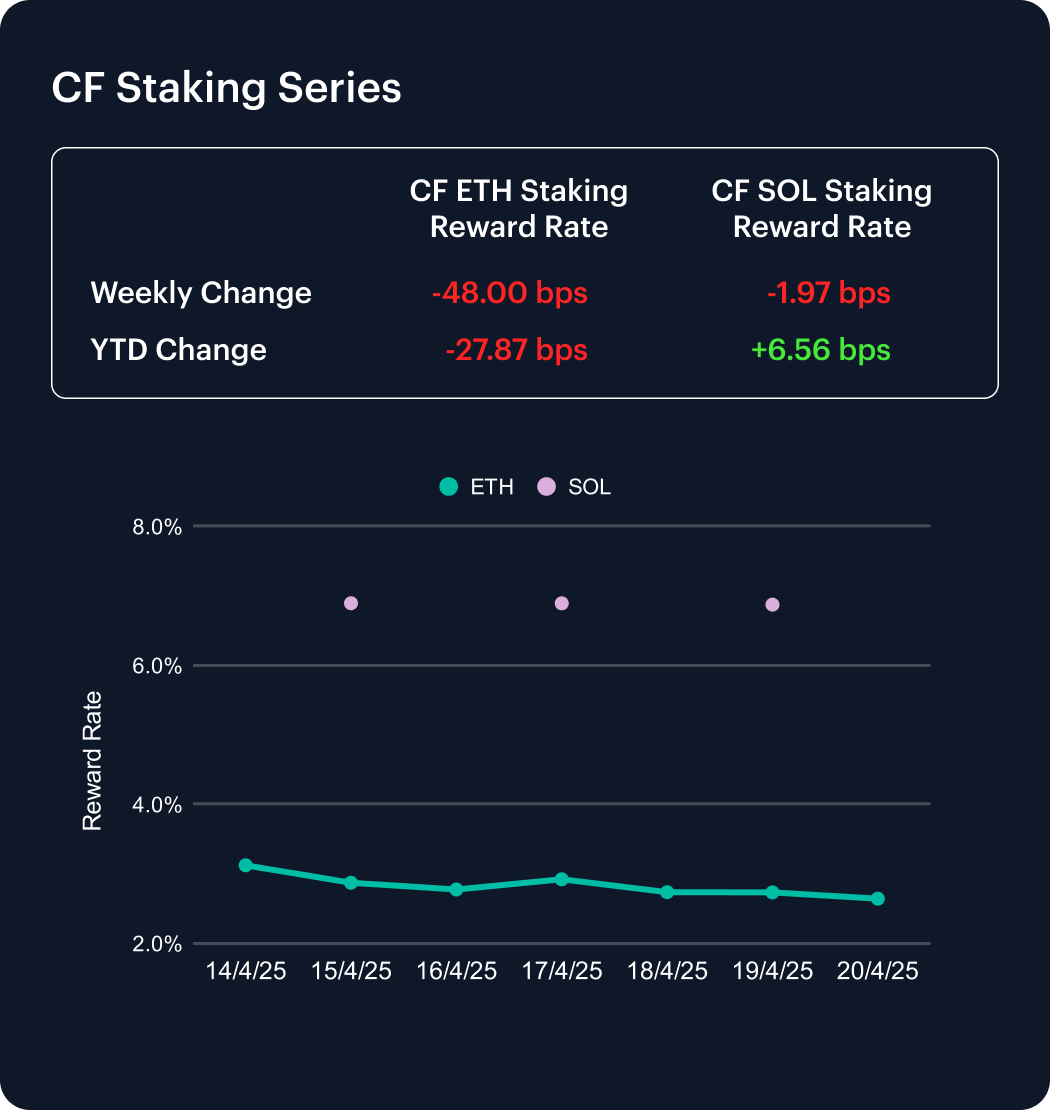
The CF Ether Staking Reward Rate Index (ETH_SRR) declined notably this week, dropping 48 basis points to 2.64%, a 15.36% weekly decrease. Year-to-date, ETH_SRR is down 27.87 bps, reflecting a 9.53% cumulative decline and highlighting persistent pressure on Ethereum staking rewards.
Meanwhile, the CF SOL Staking Reward Rate Index (SOL_SRR) edged down 1.97 bps to 6.88%, a modest 0.29% weekly dip. Despite the pullback, SOL_SRR remains up 6.56 bps in 2025, representing a 0.96% YTD increase. The continued divergence signals Ethereum’s reward compression, while Solana’s staking environment holds more stable footing.
Market Cap Index Performance
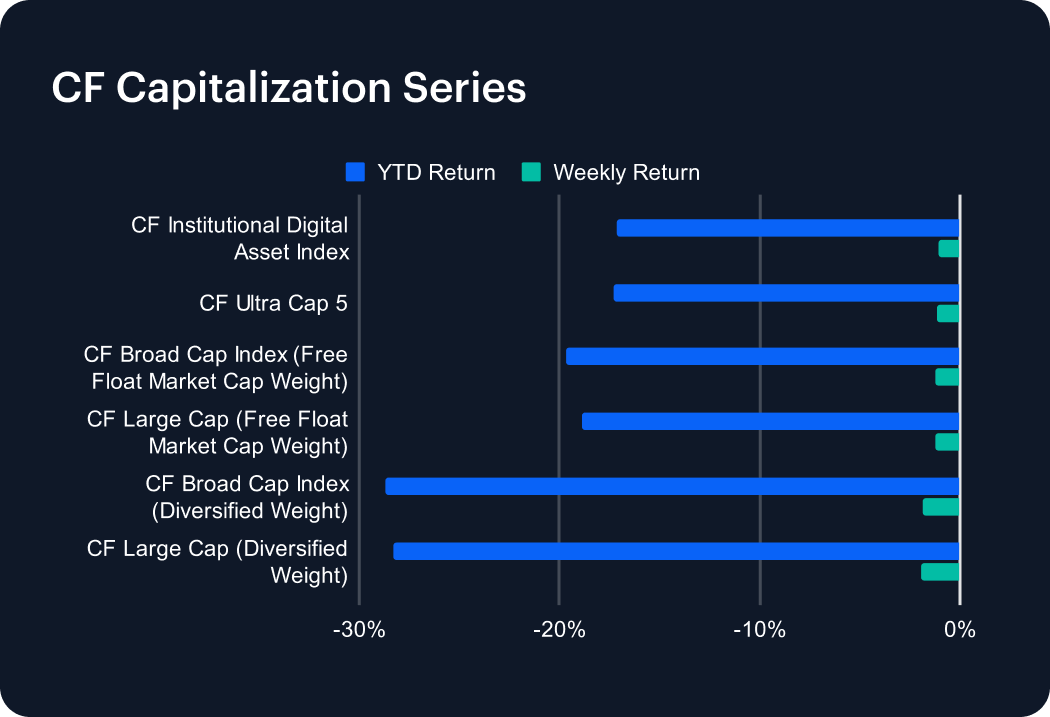
The CF Capitalization Series declined this week, with losses across all indices amid broad-based market weakness. Diversified-weighted indices underperformed their free-float market cap-weighted counterparts, continuing a recent trend. The CF Large Cap Index (Diversified Weight) fell 1.95%, deepening its year-to-date (YTD) loss to -28.29%, while the CF Broad Cap Index (Diversified Weight) dropped 1.90%, bringing its YTD return to -28.65%. Among free-float market cap-weighted indices, the CF Broad Cap and CF Large Cap indices declined 1.24% and 1.26%, respectively. The CF Ultra Cap 5 slipped 1.15%, and the CF Institutional Digital Asset Index was down 1.08%. The week’s decline highlights persistent market caution, with larger-cap tokens faring slightly better than their diversified-weighted counterparts.
Classification Series Analysis
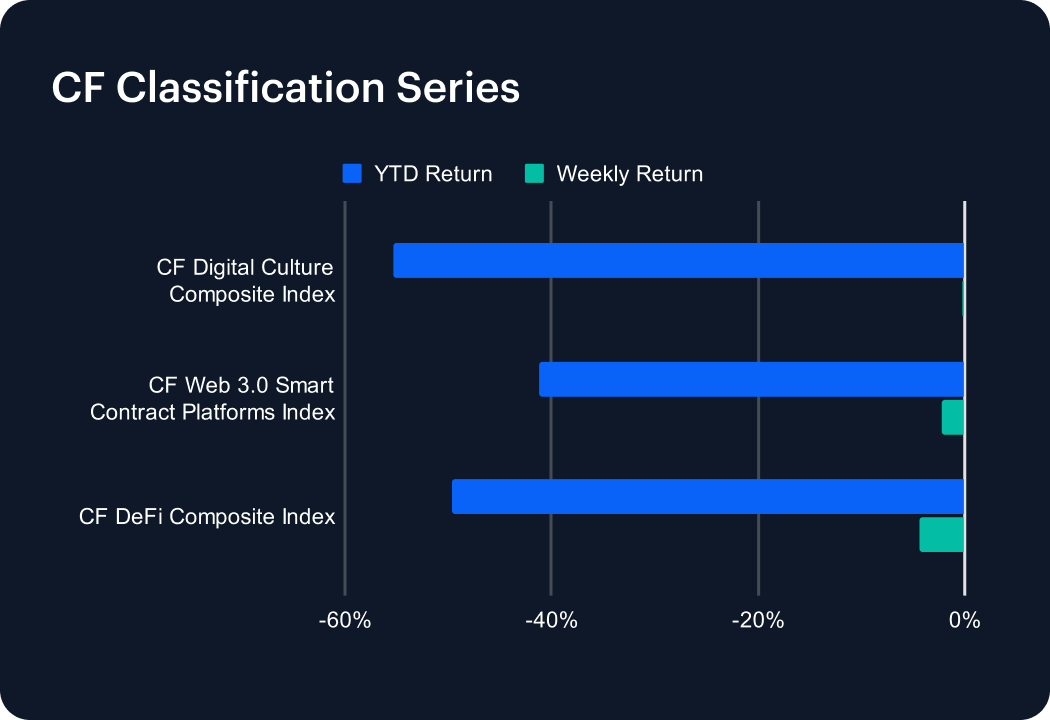
The CF Classification Series Indices declined this week, as several key digital asset verticals extended their year-to-date losses amid renewed market weakness. The CF DeFi Composite Index led the pullback with a 4.43% weekly drop, widening its YTD decline to -49.61%. The CF Web 3.0 Smart Contract Platforms Index followed, falling 2.17% and bringing its YTD return to -41.27%. Meanwhile, the CF Digital Culture Composite Index posted a marginal 0.20% decline, though it remains the weakest performer in 2025 with a cumulative loss of -55.36%. This week’s downturn underscores continued investor caution in small-cap and thematic segments. While broader markets have shown intermittent strength, sentiment within more speculative verticals remains fragile and highly sensitive to shifts in risk appetite.
Volatility
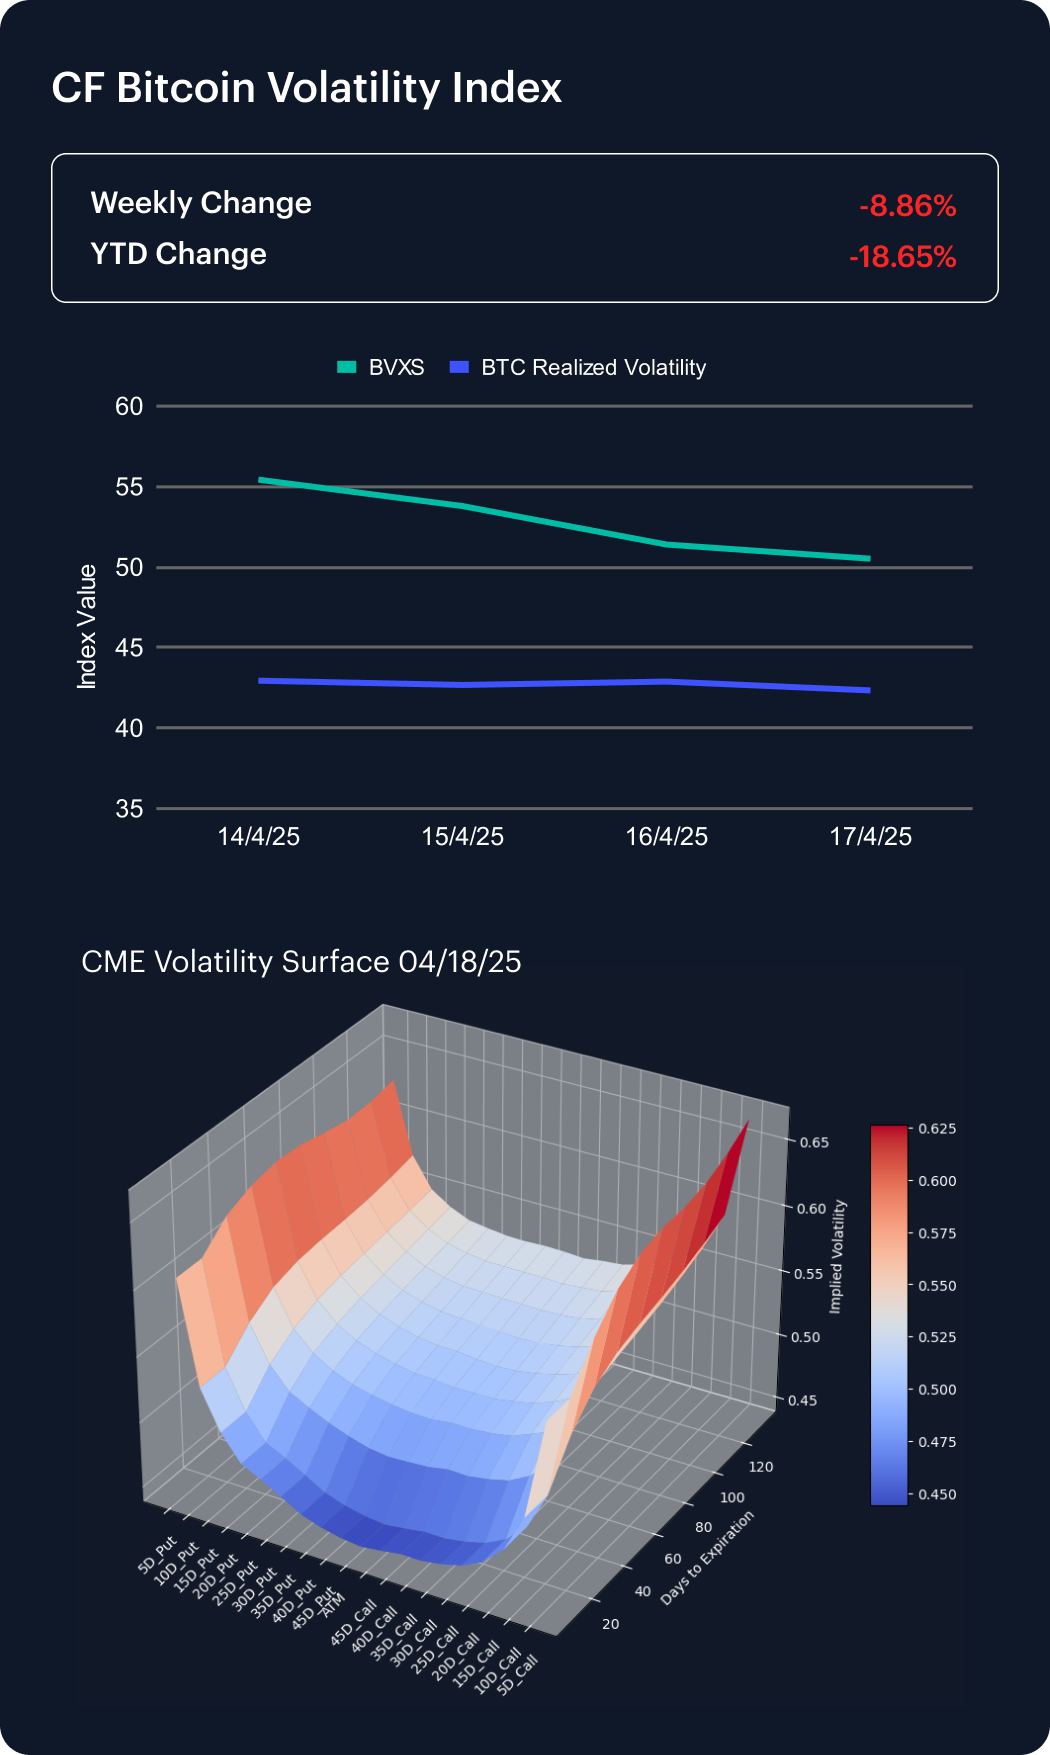
The CF Bitcoin Volatility Index Settlement Rate (BVXS) declined 8.86% over the past week, closing at 50.52 and extending its year-to-date drop to 18.65%. This continued decline in implied volatility underscores a broader easing in long-term market uncertainty. Realized volatility remained relatively flat, dipping slightly from 42.94 to 42.34, suggesting stable short-term price fluctuations.
According to CME Bitcoin Volatility Surface data, skew levels at the 10, 15, 20, and 25 delta points shifted positive across the board—signaling a meaningful shift in sentiment. The move suggests reduced demand for downside protection and a growing willingness among investors to position for potential upside. As volatility indicators stabilize, investor posture appears to be cautiously transitioning from defensive to opportunistic.
Interest Rate Analysis
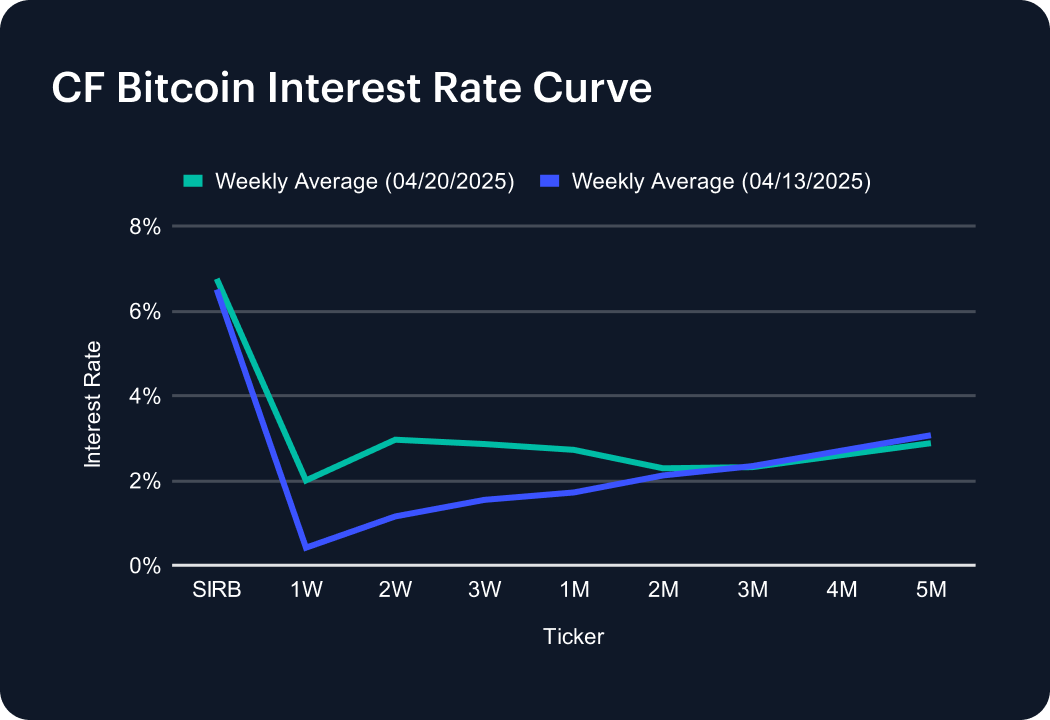
The CF Bitcoin Interest Rate Curve shifted higher again this past week, driven by a rise in short-term borrowing costs. The Short-Term Interest Rate Benchmark (SIRB) climbed to 6.76% from 6.50%, reflecting intensified demand for short-term funding. Short-dated tenors jumped, with the 1-week rate at 2.00%, the 2-week at 2.96%, and the 3-week at 2.86%. One-month funding also rose to 2.72%, while longer-dated tenors were mixed—4-month and 5-month rates edged lower to 2.60% and 2.88%, respectively. The steepening front end of the curve suggests renewed short-term positioning and leverage demand, even as appetite for extended exposure appears to be cooling slightly.
The information contained within is for educational and informational purposes ONLY. It is not intended nor should it be considered an invitation or inducement to buy or sell any of the underlying instruments cited including but not limited to cryptoassets, financial instruments or any instruments that reference any index provided by CF Benchmarks Ltd. This communication is not intended to persuade or incite you to buy or sell security or securities noted within. Any commentary provided is the opinion of the author and should not be considered a personalised recommendation. Please contact your financial adviser or professional before making an investment decision.
Note: Some of the underlying instruments cited within this material may be restricted to certain customer categories in certain jurisdictions.
Changes to the Token Market Price Benchmarks Series - Market Prices – 21 July 2026
The Administrator has confirmed changes to the Token Market Price Family for the period 14 July 2026 to 21 July 2026.

CF Benchmarks
Softer CPI Reprices July Hike Risk & Lifts Digital Assets
Digital assets extended their recovery over the past week as cooler US inflation prints repriced Fed expectations; the bid was broad across the large cap indices, growth factor leadership returned, stablecoin funding repriced lower, and stress stayed isolated in names hit by token-specific news.
Mark Pilipczuk
Notice of the Demising of CF Dai-Dollar Settlement Price and Spot Rate
The Administrator announces that it will demise the CF Dai-Dollar Settlement Price (DAIUSD_RR) and CF Dai-Dollar Spot Rate (DAIUSD_RTI) which are members of the CF Digital Asset Index Family.
CF Benchmarks
By clicking Accept, you consent to CF Benchmarks's use of cookies.
Visit Cookie Settings to learn how CF Benchmarks uses cookies and to adjust your preferences.