
Apr 02, 2026
War, the Fed, and a Market on Edge
Key takeaways for the month
Macro, geopolitical, and policy uncertainty escalated sharply in March as the U.S.-Israel conflict with Iran, which began at the end of February, intensified and became the dominant market driver. The sustained surge in oil prices and cross-asset volatility tightened financial conditions and weighed heavily on risk appetite. The Federal Reserve held rates steady but delivered a hawkish message, with Chair Powell emphasizing that rate cuts remain contingent on further inflation progress and noting that a hike had been discussed, prompting sharp repricing in rate expectations. Bitcoin traded as a high-beta macro asset, declining alongside equities before stabilizing into month-end as signs of capitulation emerged. Broader digital asset markets underperformed, with higher-beta segments facing continued selling pressure as liquidity thinned and positioning unwound. With regulatory progress limited and policy clarity absent, investors remained defensive, awaiting clearer signals on both the geopolitical trajectory and the Fed's path forward.
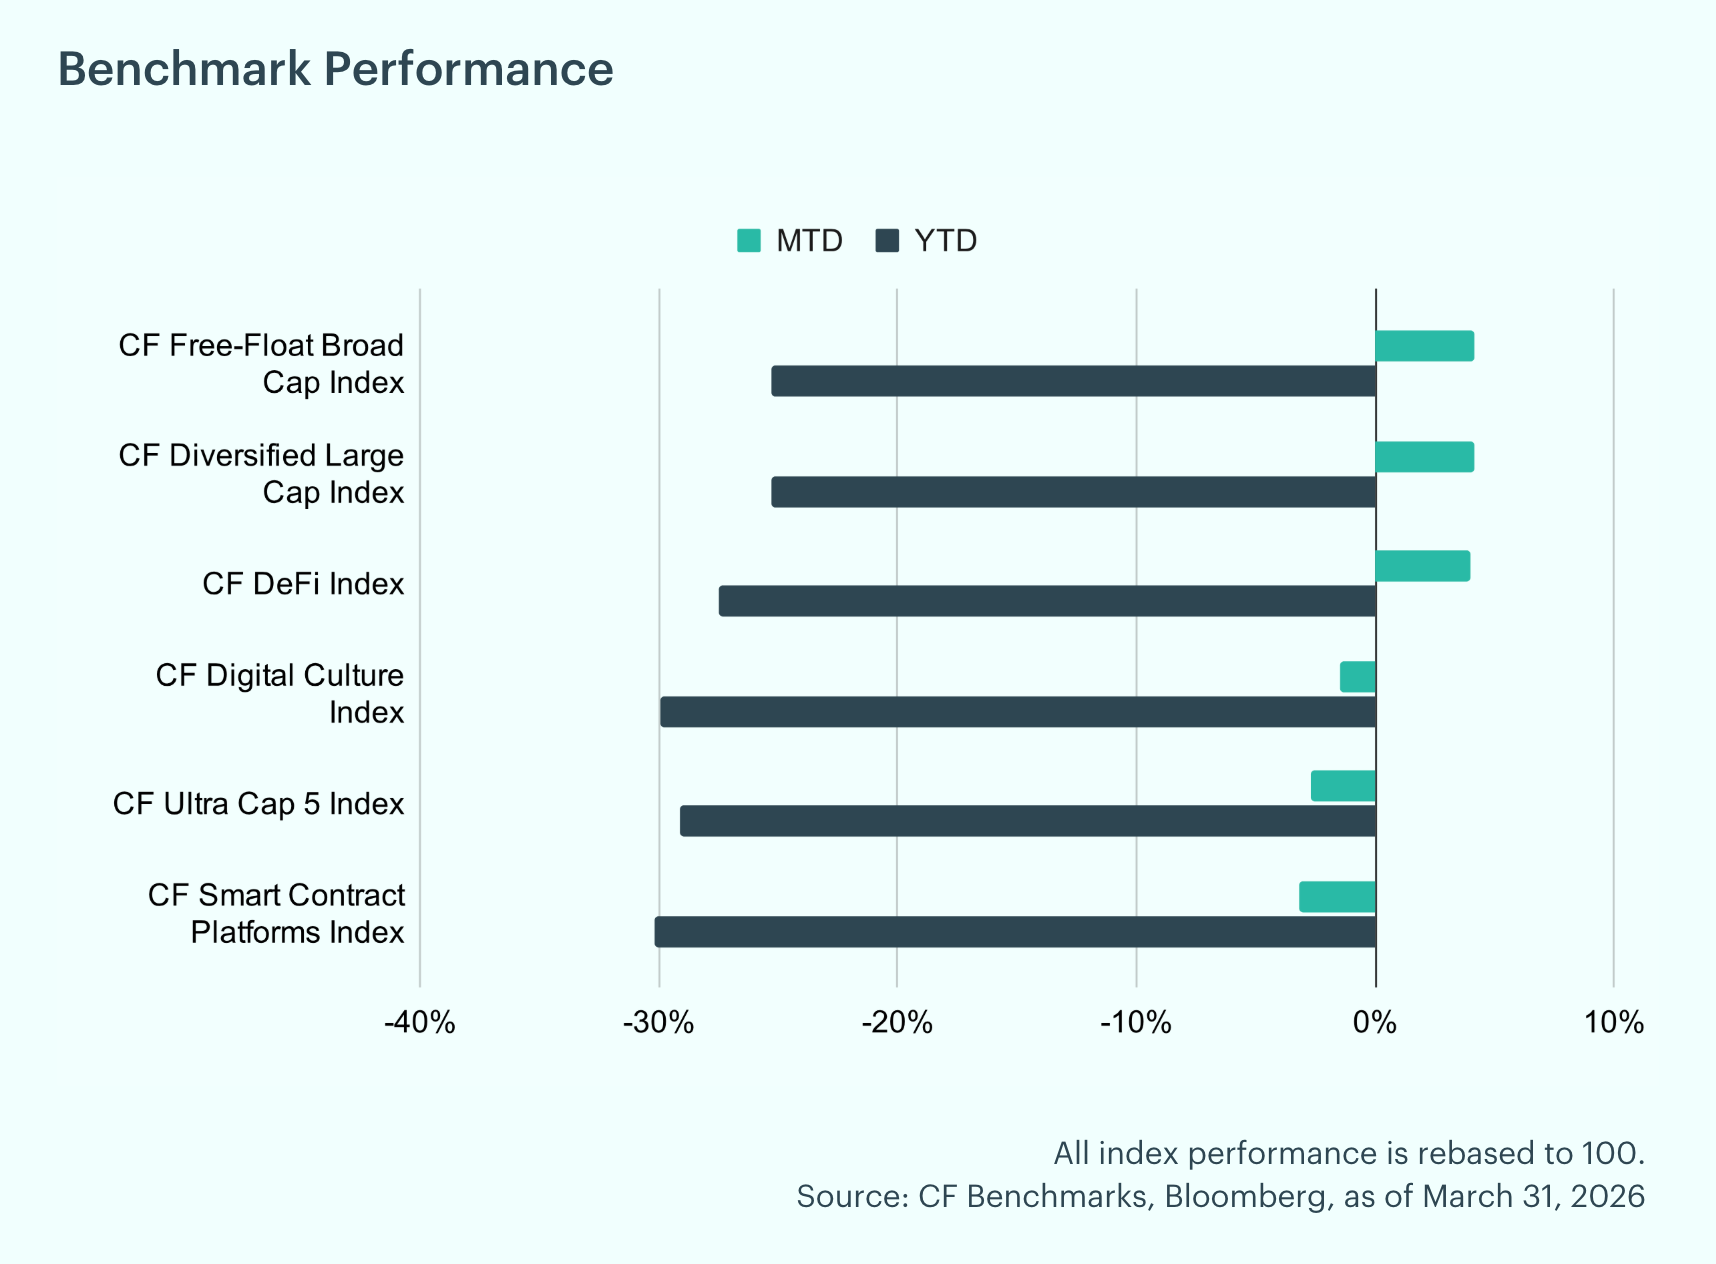
Early Signs of Differentiation: The 2026 drawdown showed early signs of differentiation, with large-cap indices posting modest gains even as higher-beta segments continued to slide. The CF Ultra Cap 5 Index led to the upside, rising 4.2% month-to-date, with the CF Free-Float Broad Cap and CF Diversified Large Cap indices close behind at 4.1% and 4.0%, respectively. The CF Smart Contract Platforms Index declined 1.5%, while the CF DeFi Index fell 2.7% and the CF Digital Culture Index lost 3.2%. On a year-to-date basis, losses remain steep across the board, with the CF Diversified Large Cap Index down 27% and most other indices off between 25% and 30%.
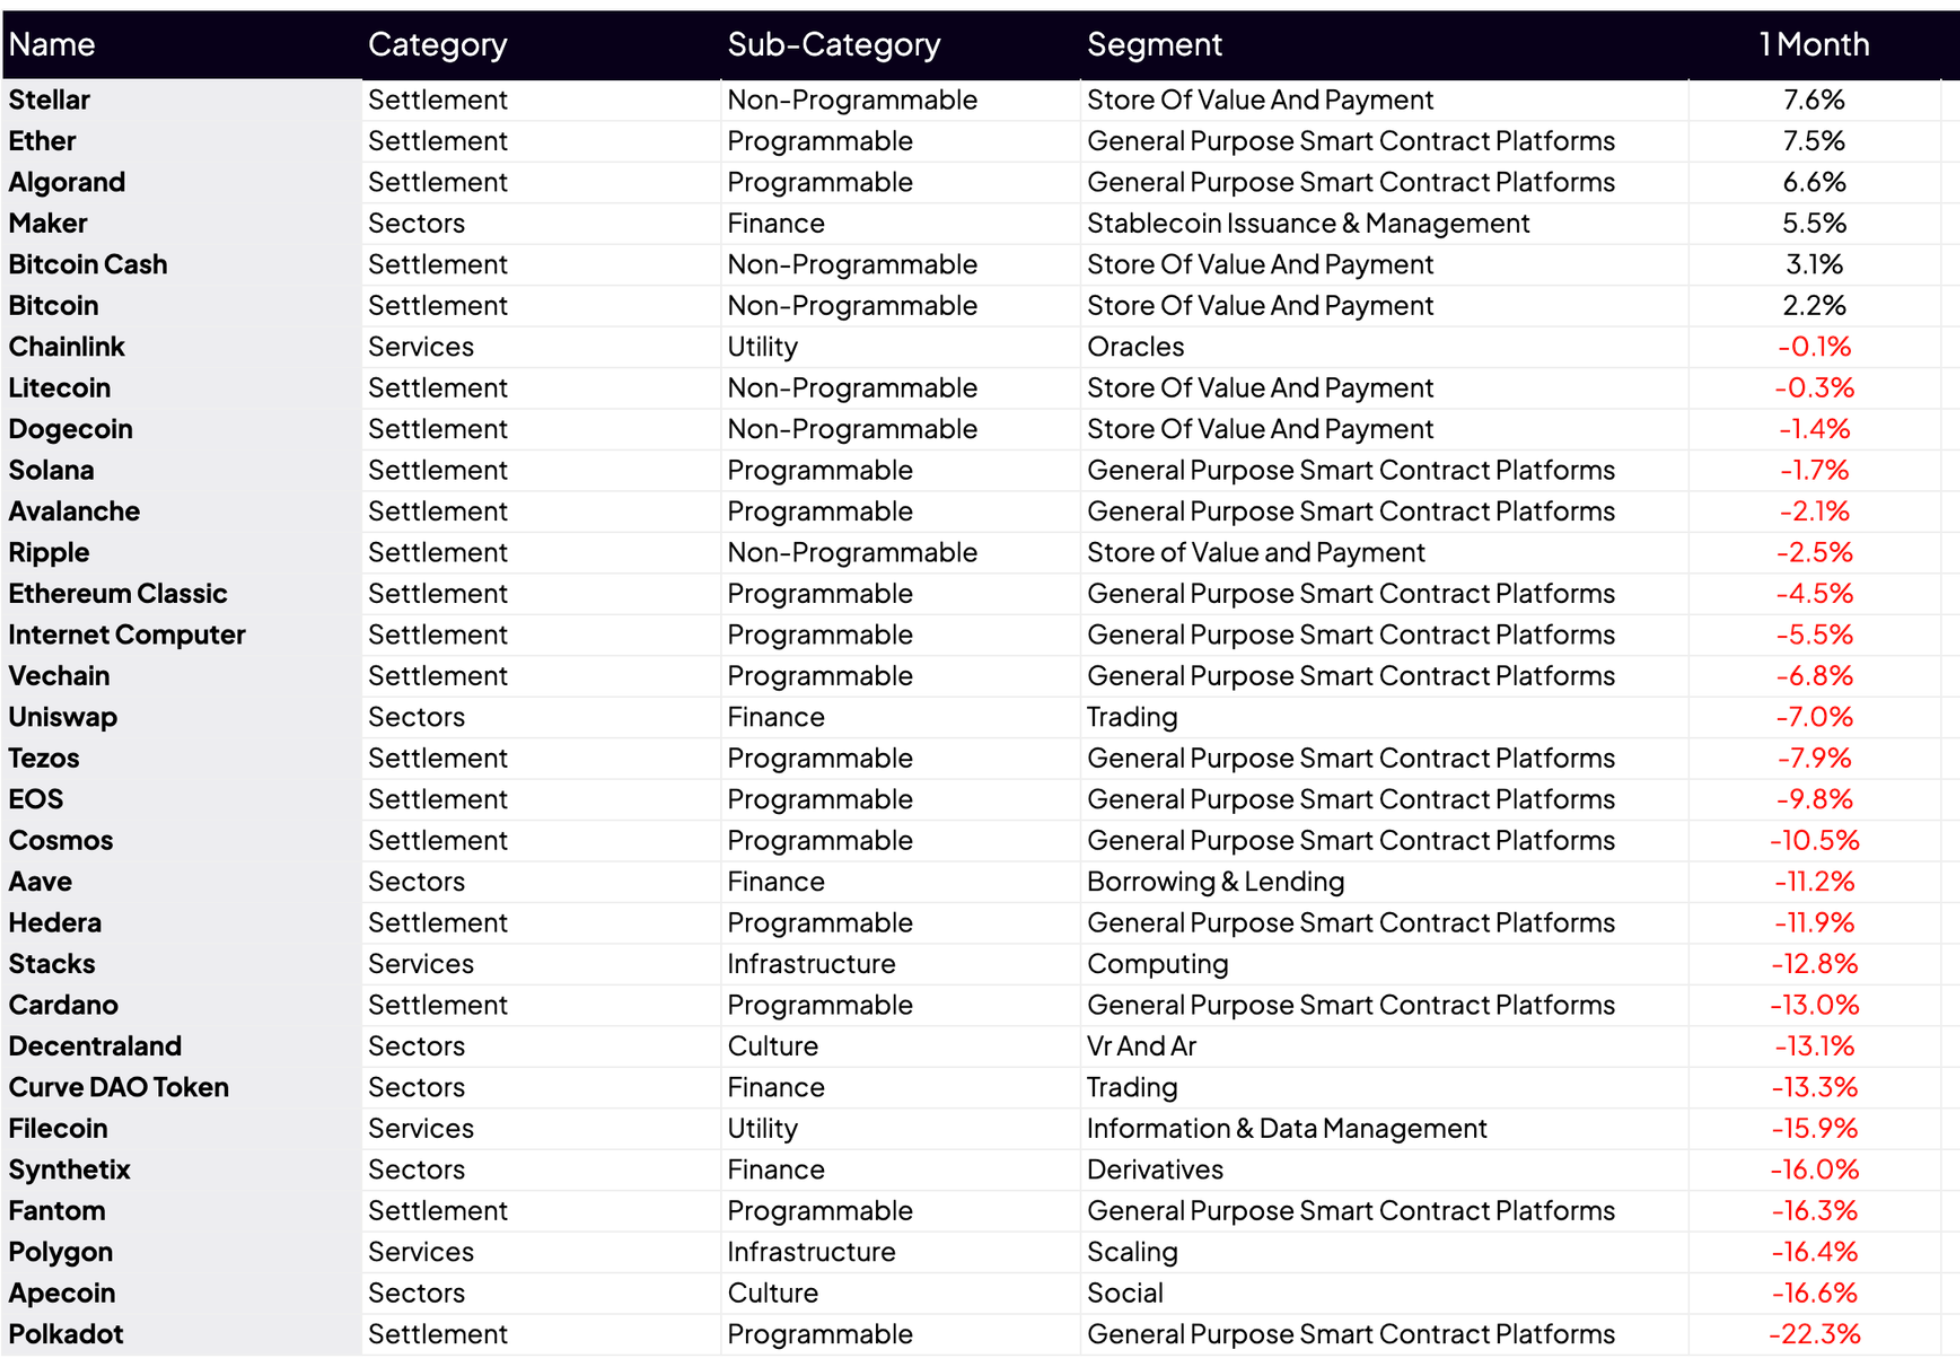
Individual Movers: Stellar (XLM) led March's major crypto performers with a 7.6% gain, supported by growing investor interest in cross-border payments. Ether (ETH) followed closely at +7.5%, benefiting from large-cap rotation. Algorand (ALGO) rounded out the leaders at +6.6%, outperforming most smart contract platforms on the back of continued ecosystem development and DeFi growth. Polkadot (DOT) trailed March's majors with a 22.3% decline, weighed down by a rotation away from smaller-cap assets. Apecoin (APE) followed at -16.6%, pressured by persistent weakness in the NFT and metaverse sectors. Polygon (POL) fell 16.4%, hampered by continued competitive pressure from alternative Ethereum scaling solutions.
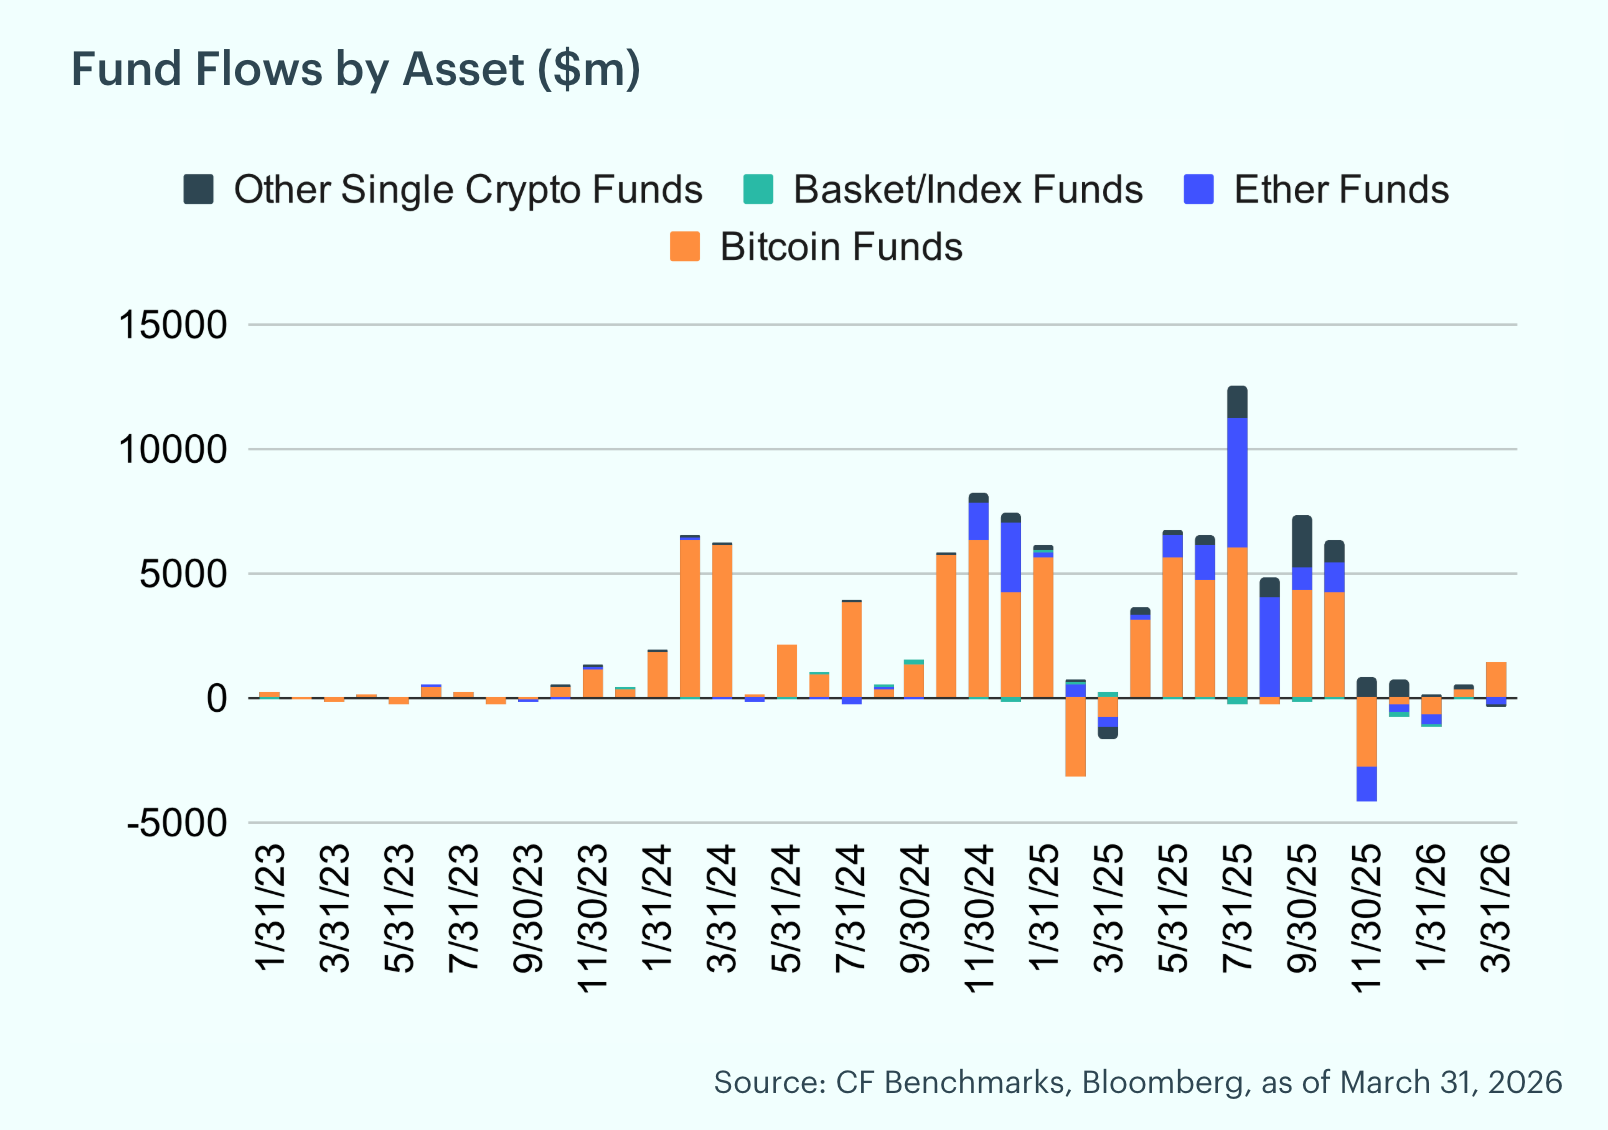
Fund Flows Accelerate: March saw a significant acceleration in fund flow activity, with digital asset funds recording approximately $1.0 billion in net inflows, building on February's $500 million of inflows. Bitcoin funds dominated with $1.4 billion in inflows, though this was partially offset by outflows across other categories. Ether funds recorded $266 million in outflows, while Basket/Index funds saw $28 million in outflows and Other Single Crypto funds lost $71 million. Regionally, flows were heavily concentrated in North America at $2.2 billion, with Asia Pacific contributing $31 million and South America adding $3 million, while Europe recorded $19 million in outflows.
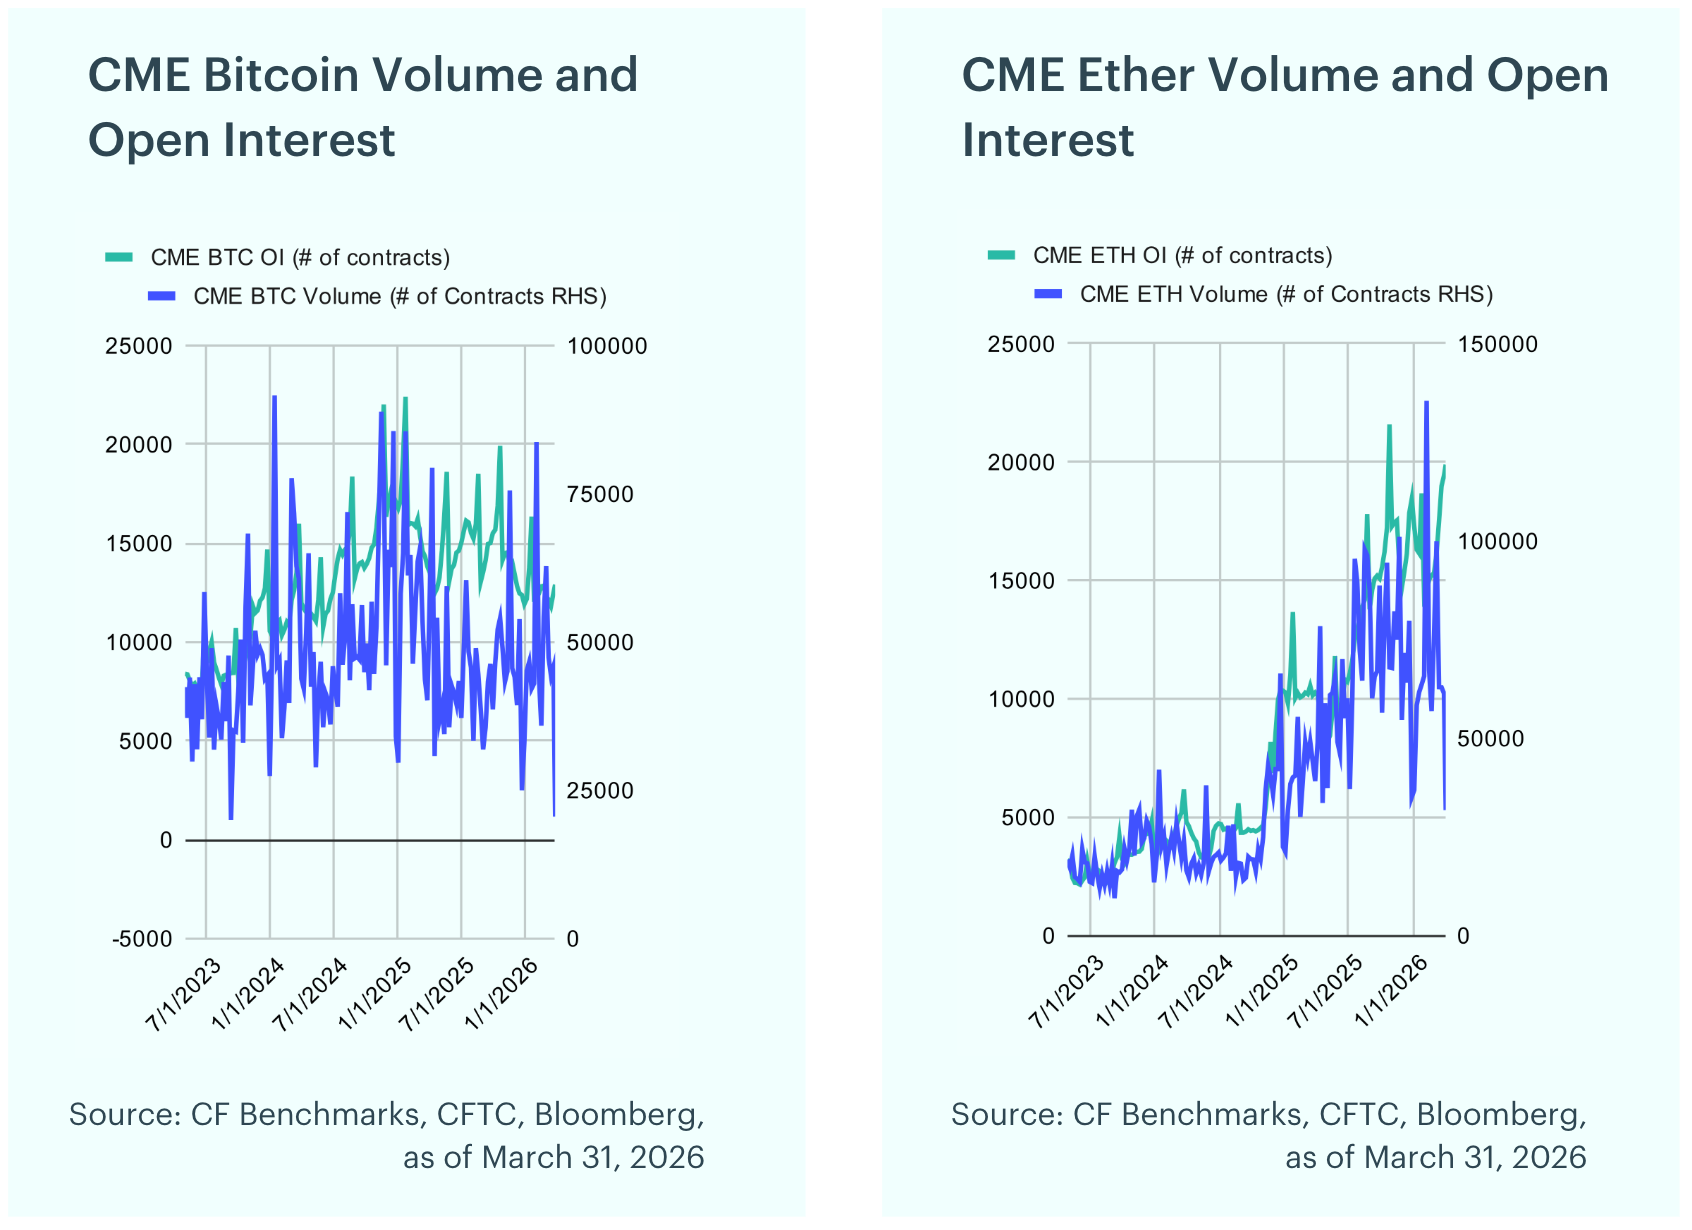
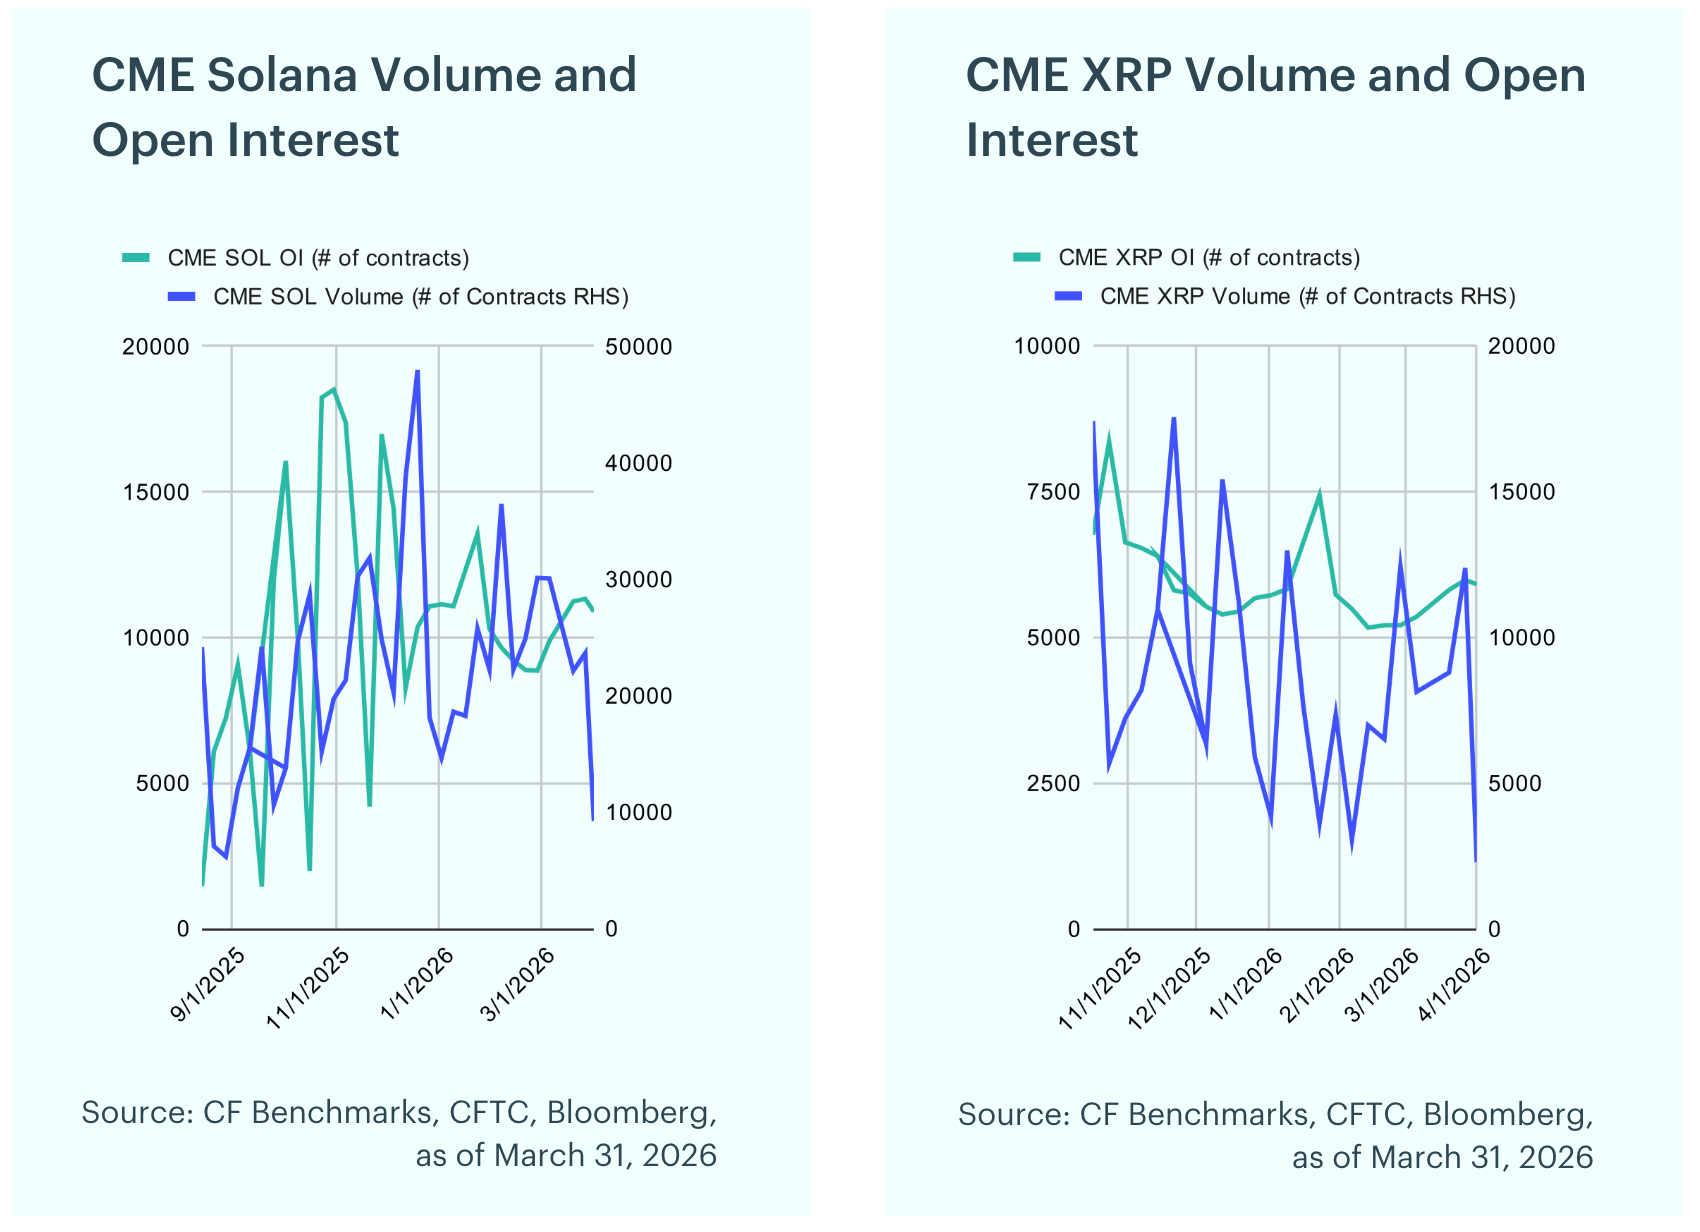
Futures Positioning Diverges: In March, open interest rose sharply for Ether (+26.8% to 19,434), Solana (+27.8% to 11,324), and XRP (+14.9% to 5,982), while Bitcoin (-2.9% to 12,487) saw a modest decline. Peak volumes were recorded in early March: Bitcoin with 62,817 contracts, Ether 99,974 contracts, and Solana 30,069 contracts, while XRP volume peaked later in the month at 12,378 contracts.
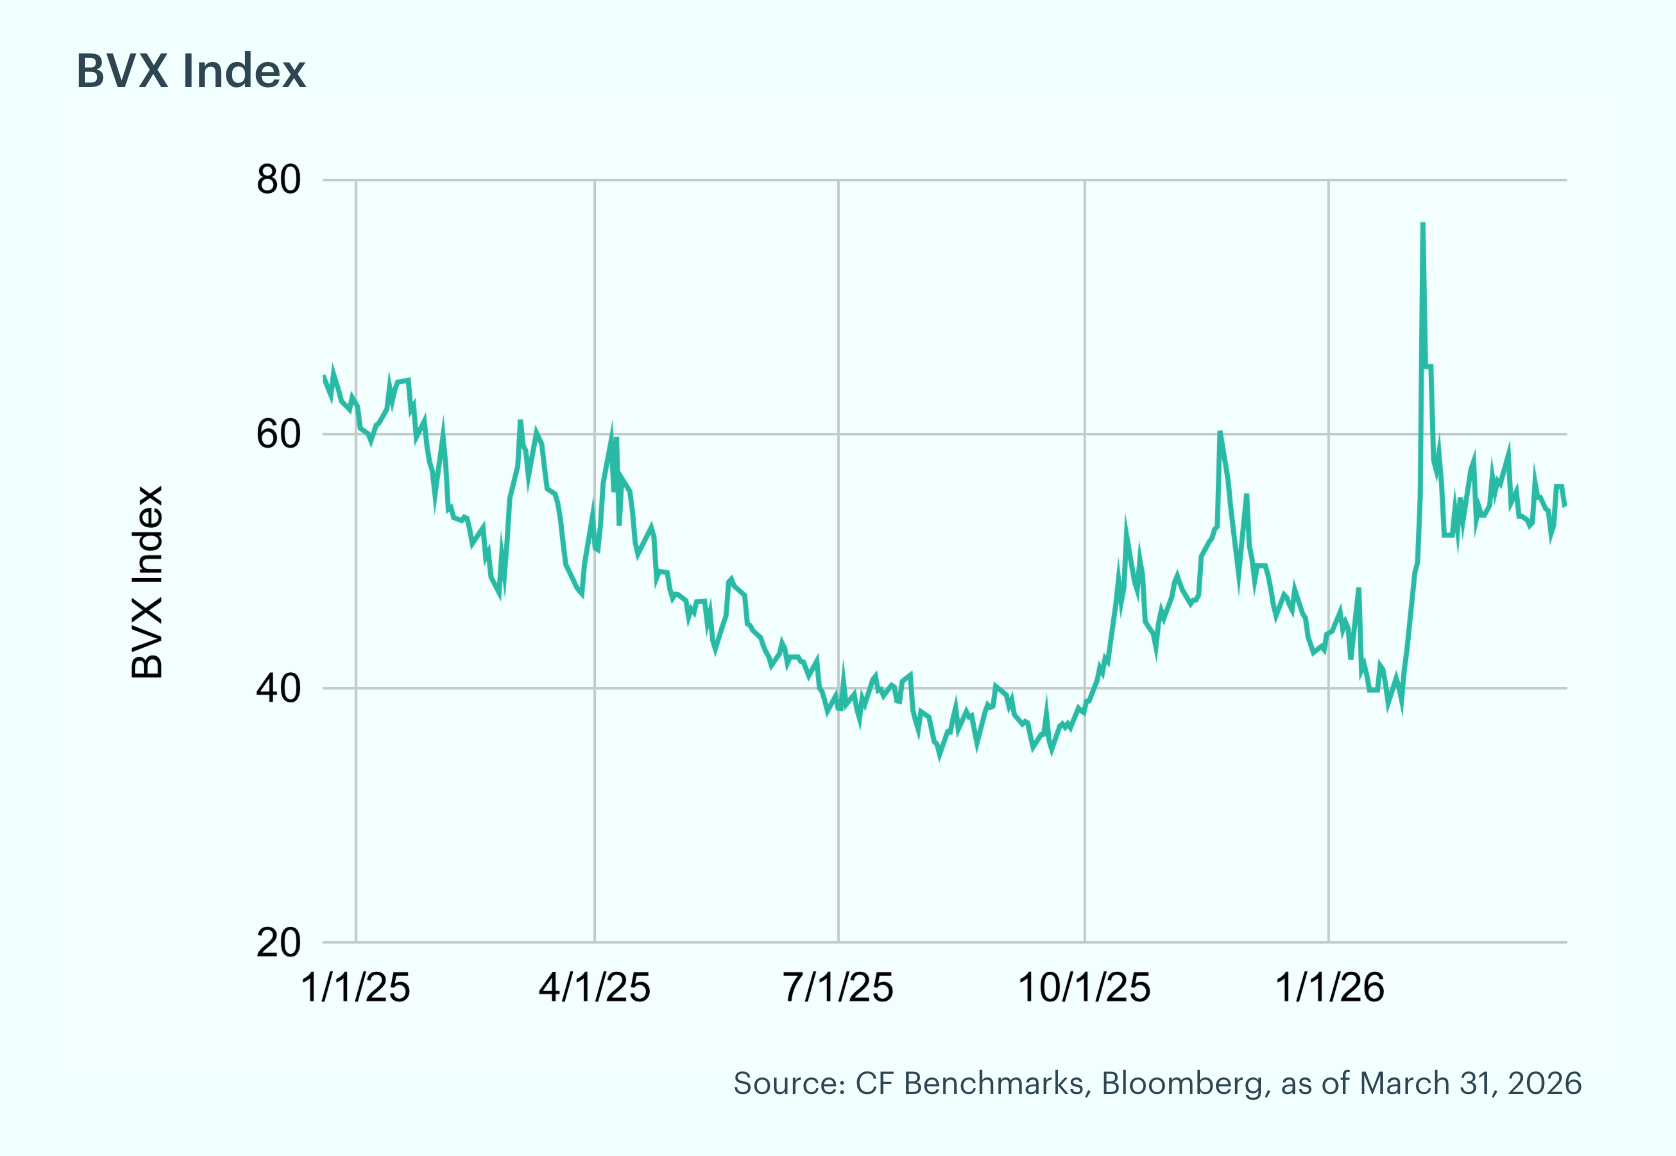
Bitcoin Volatility Normalizes: The CF Bitcoin Volatility Index Settlement Rate (BVXS) is a daily benchmark that provides a forward-looking, 30-day constant-maturity measure of implied volatility, derived from CFTC-regulated Bitcoin option contracts traded on the CME. The BVX reflects the fair strike of a variance swap. The BVX ranged from 52.13 to 58.27 in March, closing the month at 54.54. The z-score remained subdued, ranging from -1.54 to +0.73, indicating volatility was more muted throughout the month.
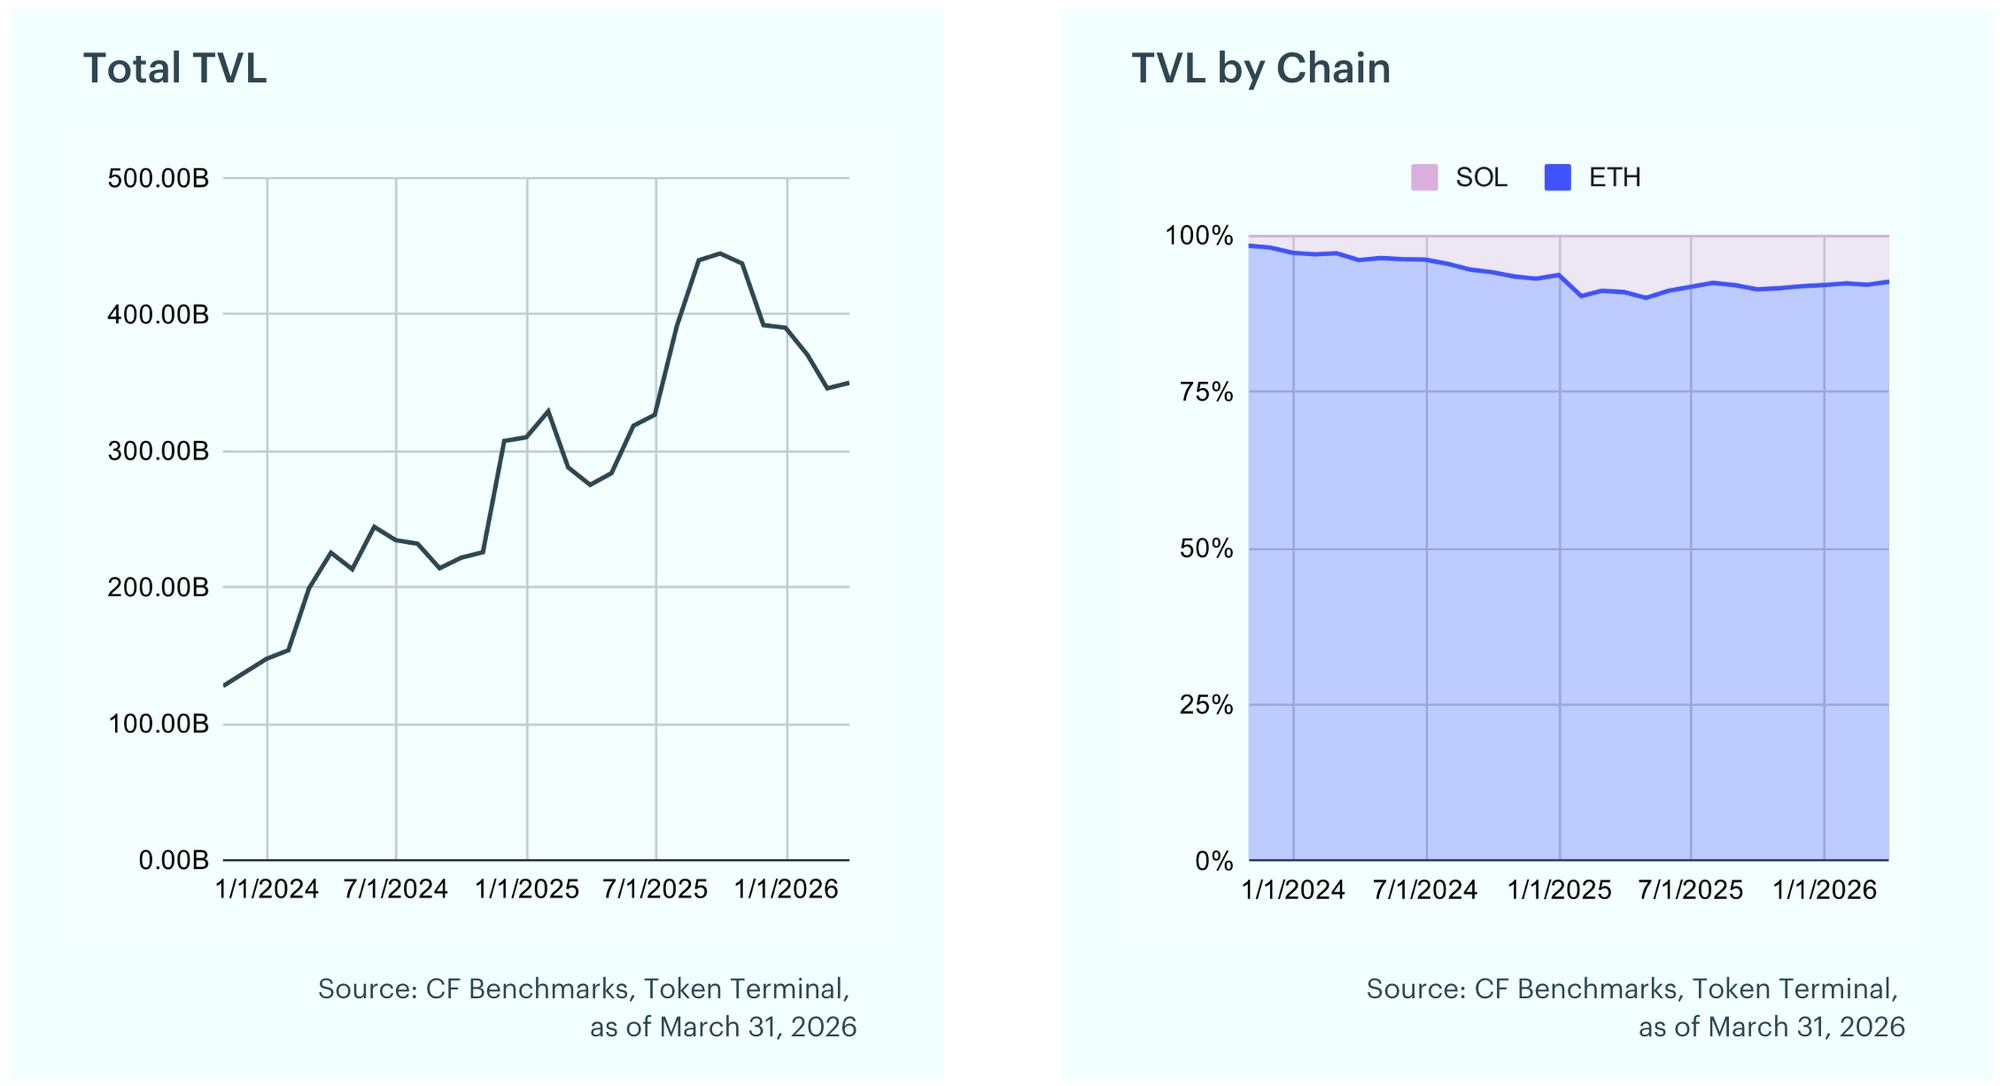
DeFi TVL Pulls Back: Total Value Locked rose 1.2% in March to $350.0B, up from $345.9B in February. The modest recovery was led by Ethereum, which increased to $324.1B, while Solana TVL declined to $25.9B as capital rotated toward more established DeFi ecosystems.
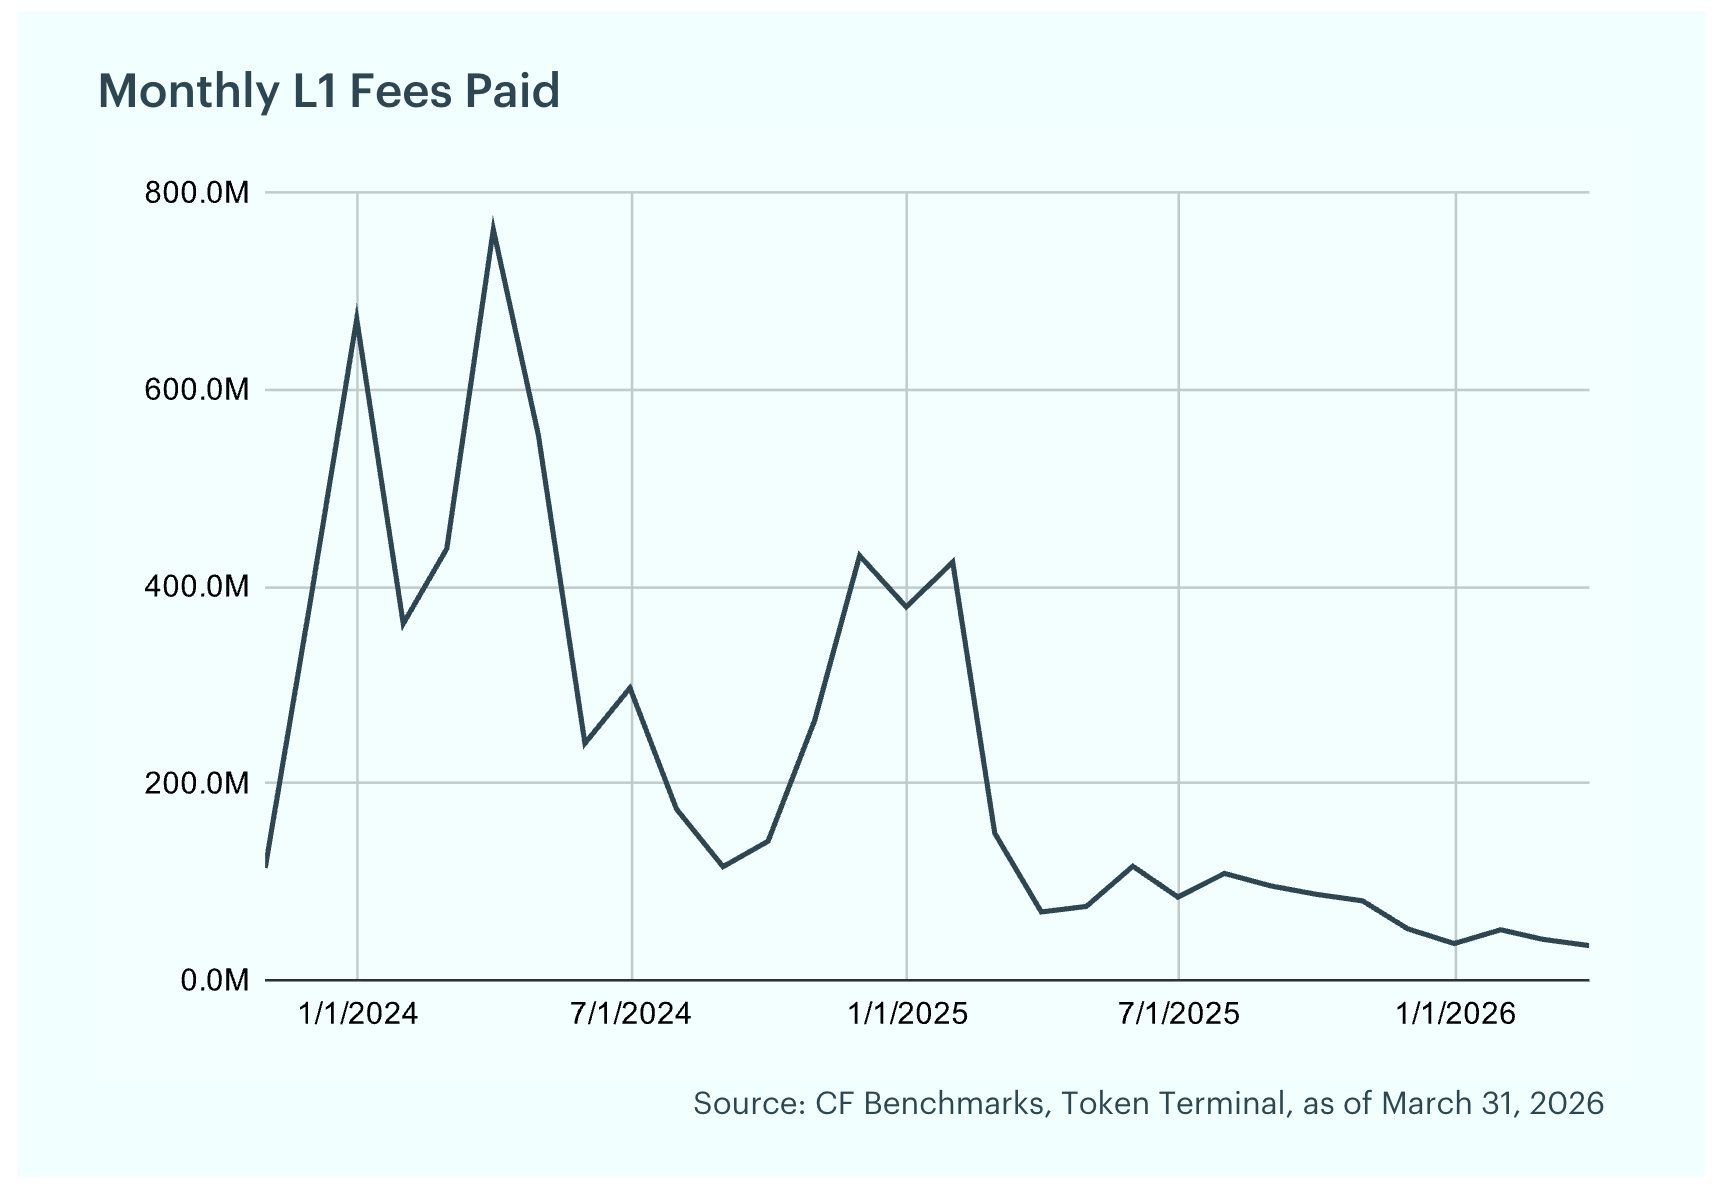
Layer-1 Fees Decline Further, Solana Still Leads: Fees are the charges users pay to record transactions and data on a blockchain and act as a gauge for demand to use these networks. They tend to rise when there is an influx of new users on-chain and can fall when activity wanes or scaling upgrades reduce costs. Total L1 fees declined further to $35.1M in March from $41.5M in February. Solana continued to lead with $19.0M (54.0%), followed by Ethereum at $10.6M (30.3%) and Bitcoin at $5.5M (15.6%). The decline was driven primarily by lower fee generation on Ethereum, which fell 30.3% month-over-month.
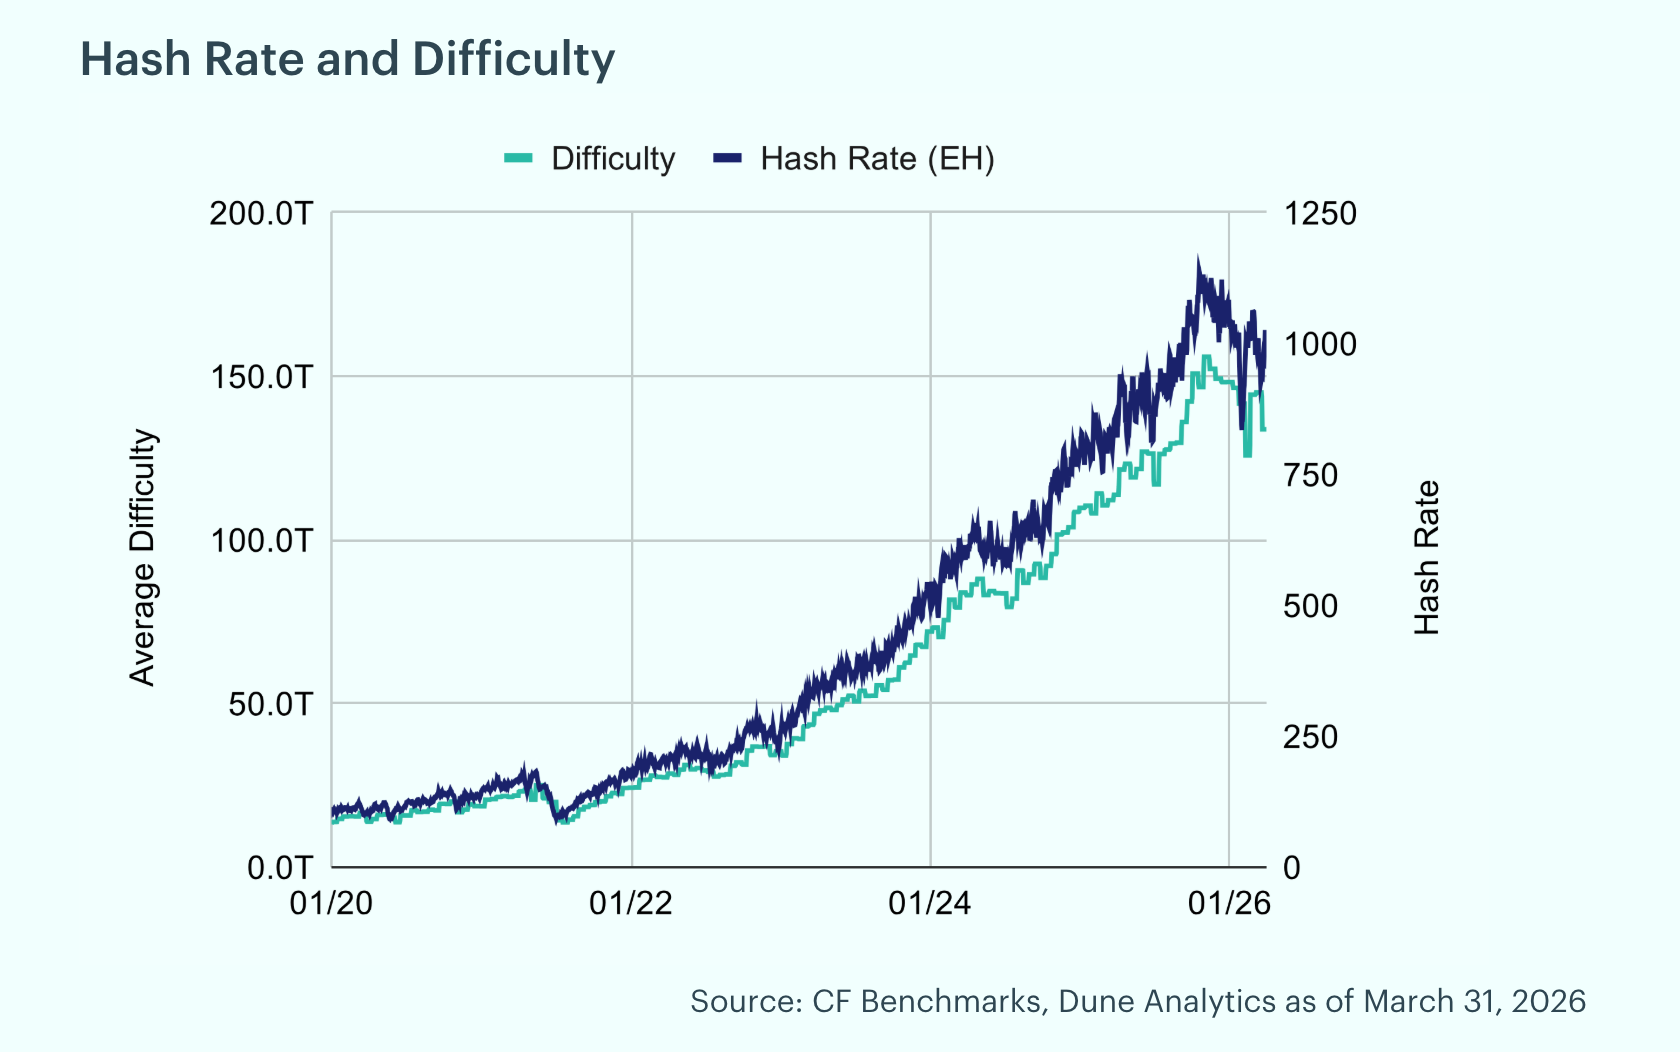
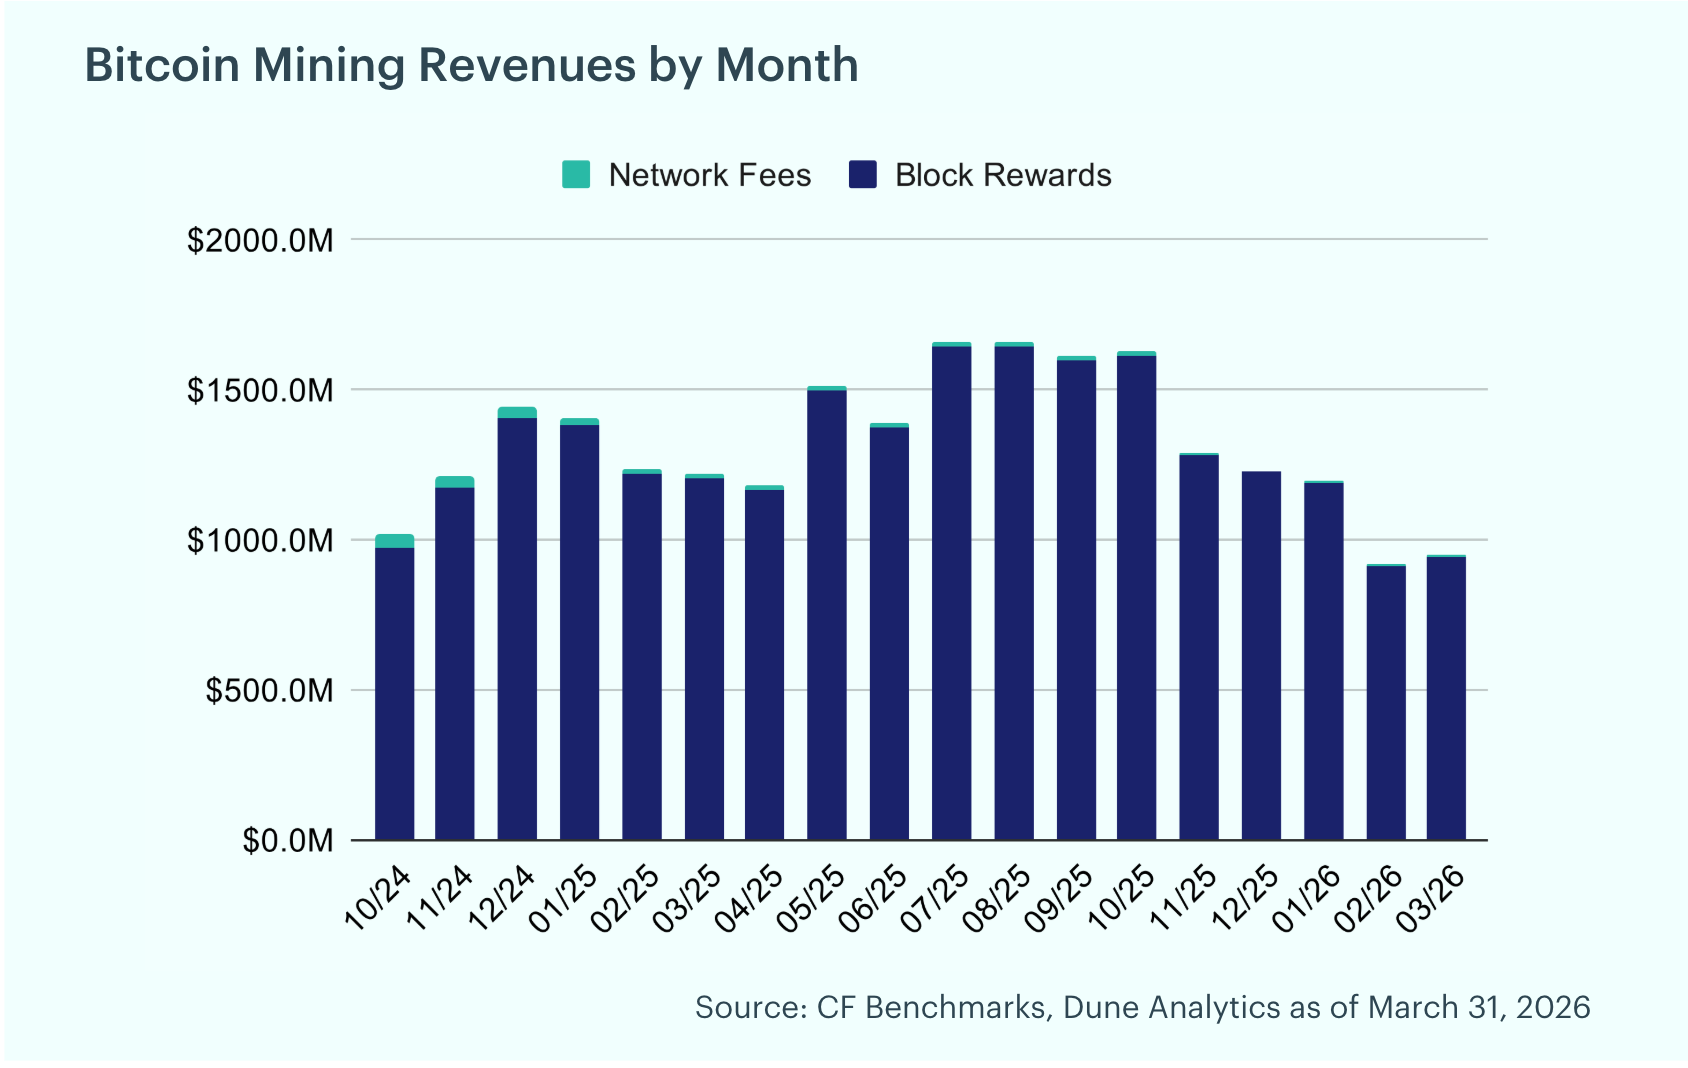
Hash Rate Retreats, Mining Revenue Recovers Modestly: Bitcoin's hash rate declined 6.8% in March, falling to 991 exahashes per second from 1,064 EH/s at February's end. Mining difficulty decreased throughout the month, ending at 133.8T (-7.3%) as miners shut down hardware in the low profitability environment. However, miners saw a 3.6% increase in revenue, with total mining revenue of $945.2 million. Of the total rewards earned, 0.6% came from transaction fees, with block rewards totaling $939.8 million and fees contributing $5.5 million. The modest recovery was supported by higher Bitcoin prices throughout the month.
To read the complete report, kindly click on the provided link (or click here to view a PDF version). Additionally, please do not forget to subscribe to our latest news and research for the most relevant institutional insights on digital assets and the top digital assets by market cap.
The information contained within is for educational and informational purposes ONLY. It is not intended nor should it be considered an invitation or inducement to buy or sell any of the underlying instruments cited including but not limited to cryptoassets, financial instruments or any instruments that reference any index provided by CF Benchmarks Ltd. This communication is not intended to persuade or incite you to buy or sell security or securities noted within. Any commentary provided is the opinion of the author and should not be considered a personalised recommendation. Please contact your financial adviser or professional before making an investment decision.
Note: Some of the underlying instruments cited within this material may be restricted to certain customer categories in certain jurisdictions.
Changes to the Token Market Price Benchmarks Series - Market Prices – 21 July 2026
The Administrator has confirmed changes to the Token Market Price Family for the period 14 July 2026 to 21 July 2026.

CF Benchmarks
Softer CPI Reprices July Hike Risk & Lifts Digital Assets
Digital assets extended their recovery over the past week as cooler US inflation prints repriced Fed expectations; the bid was broad across the large cap indices, growth factor leadership returned, stablecoin funding repriced lower, and stress stayed isolated in names hit by token-specific news.
Mark Pilipczuk
Notice of the Demising of CF Dai-Dollar Settlement Price and Spot Rate
The Administrator announces that it will demise the CF Dai-Dollar Settlement Price (DAIUSD_RR) and CF Dai-Dollar Spot Rate (DAIUSD_RTI) which are members of the CF Digital Asset Index Family.
CF Benchmarks
By clicking Accept, you consent to CF Benchmarks's use of cookies.
Visit Cookie Settings to learn how CF Benchmarks uses cookies and to adjust your preferences.