
Mar 19, 2026
The M2-Bitcoin Relationship: What the Data Actually Shows
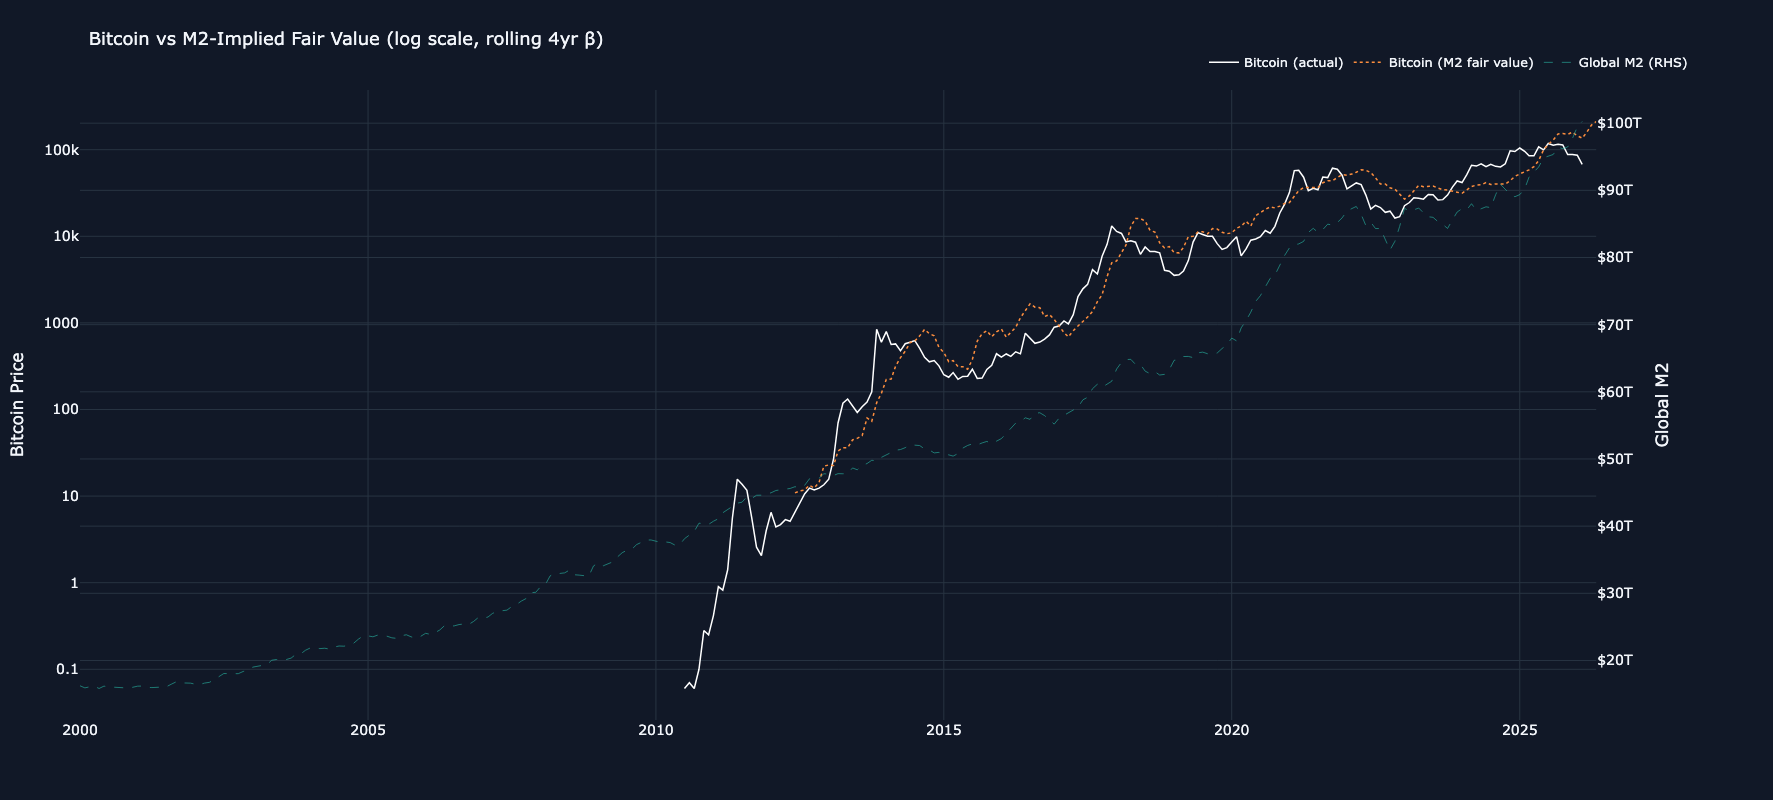
For the better part of a decade, one of the most reliable frameworks in digital asset analysis has been the relationship between Bitcoin and global M2 money supply. The logic is intuitive: as central banks expand the monetary base, a portion of that liquidity finds its way into asset markets, and Bitcoin, with its fixed issuance schedule, has historically seen outsized returns. Throughout, the rolling 4-year correlation between the two ranged between 0.4 and 0.6.
By Q4 of 2025, that relationship broke down. Over the last twelve months, global M2 has grown more than 12% while Bitcoin has declined roughly 12%. The question for allocators is whether this represents a temporary lag that will resolve in Bitcoin's favor, as every prior divergence has, or a structural regime change that demands a reassessment of how the asset responds to monetary debasement.
The March 18th FOMC decision brings this tension into sharper focus. The Committee held rates steady as expected, but Chair Powell acknowledged that progress on inflation has been slower than hoped, officials flagged the Middle East conflict as a source of elevated uncertainty, and surging oil prices are expected to keep near-term inflation expectations elevated. The updated projections pointed to hotter inflation and a flatter rate path, reinforcing the bind that runs through the rest of this analysis: liquidity conditions remain supportive by historical standards, yet the Fed's ability to ease further is constrained by sticky inflation and geopolitical risk. At the same time, a separate suite of proposals from the Fed, OCC, and FDIC would lower bank capital requirements by nearly 5% for the largest institutions and close to 8% for smaller banks, a move that could potentially free up billions for lending. If implemented, looser capital rules would expand banks' capacity to extend credit, one of the primary channels through which M2 grows. For an asset whose valuation framework rests on monetary expansion, the regulatory trajectory may matter as much as the rate path.
What the Cross-Asset Data Reveals
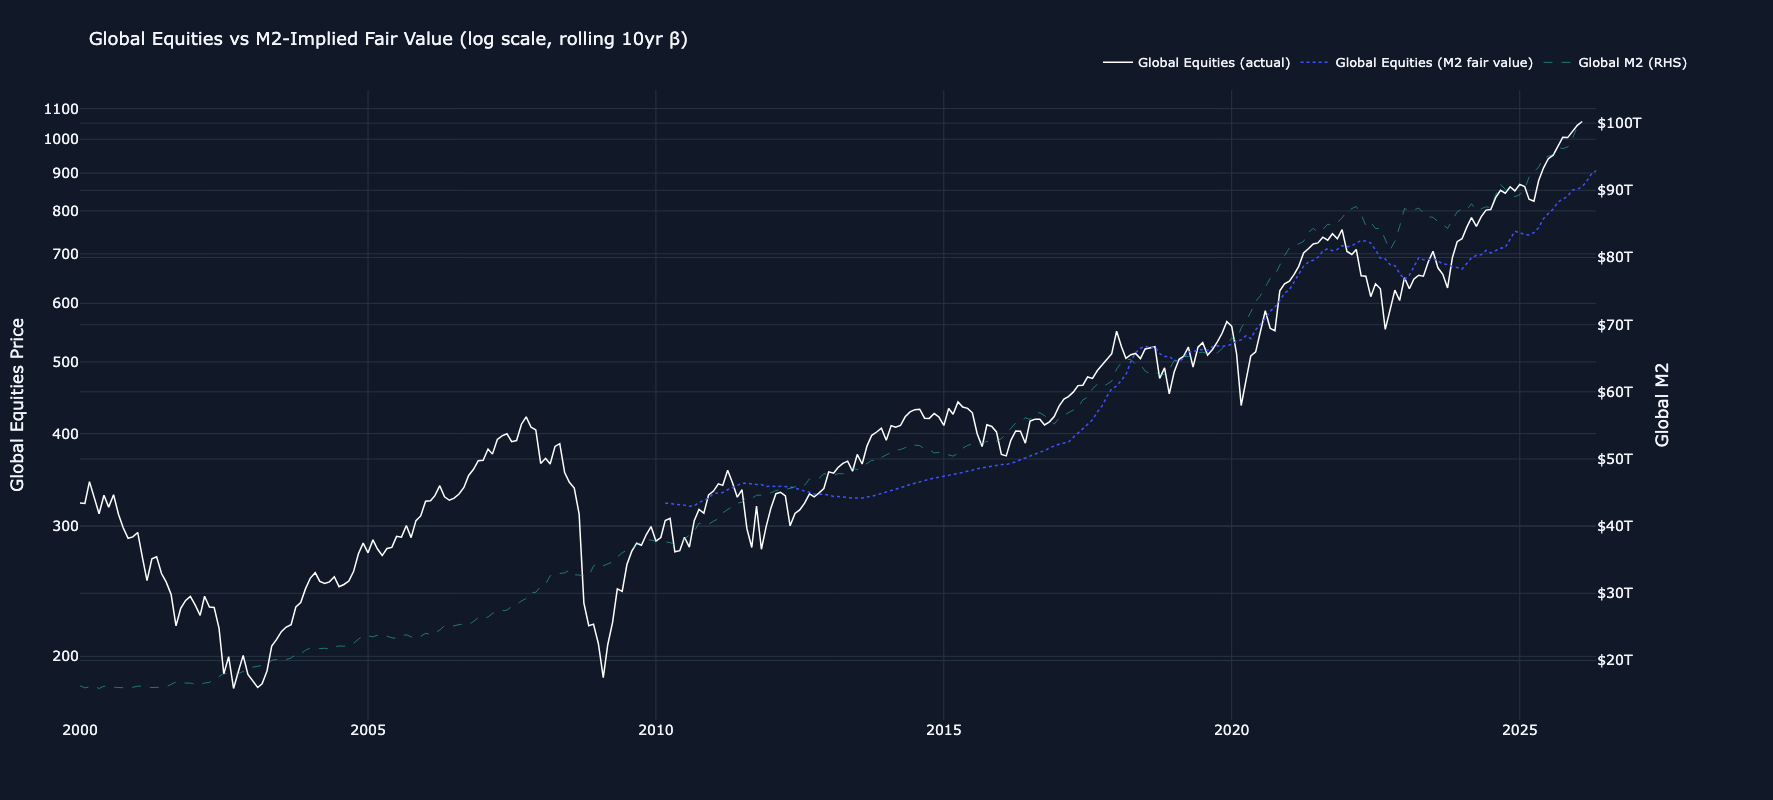
We analyzed monthly data on Bitcoin, gold, and global equities against global M2 from 2000 through February 2026, fitting rolling regression models to track the evolving sensitivity of each asset to liquidity conditions.
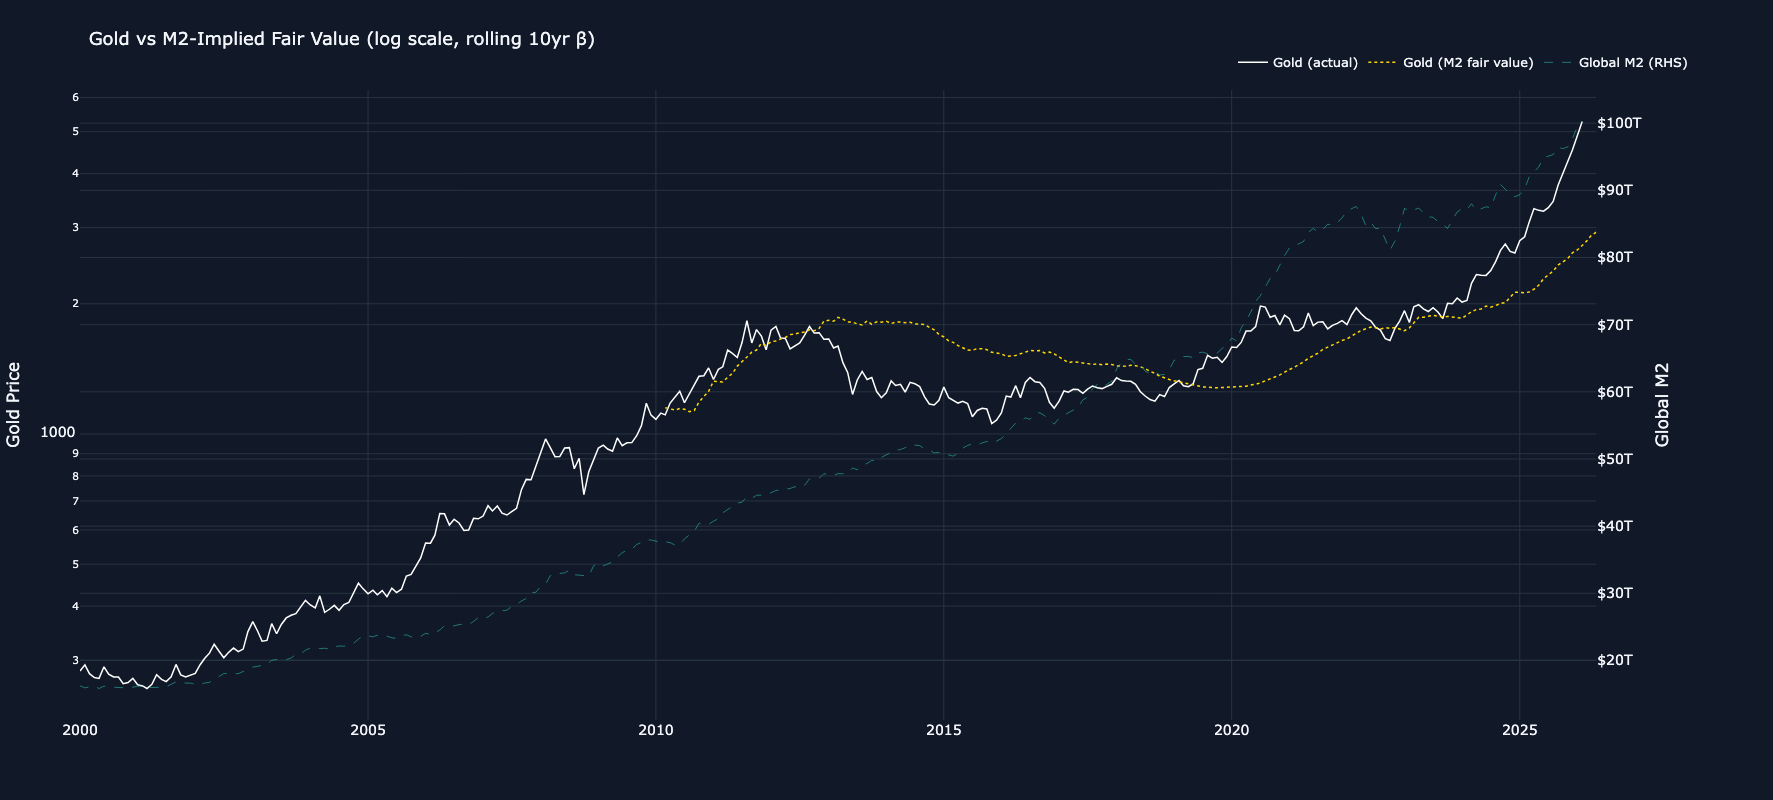
Gold and global equities have maintained stable, positive relationships with M2 throughout most of the sample period. Gold's beta to M2 has remained around 1.3 since late 2023, with an R-squared consistently near 0.72 to 0.80. Global equities show a similar pattern, with betas near 1.1 to 1.5 and R-squared values around 0.80.
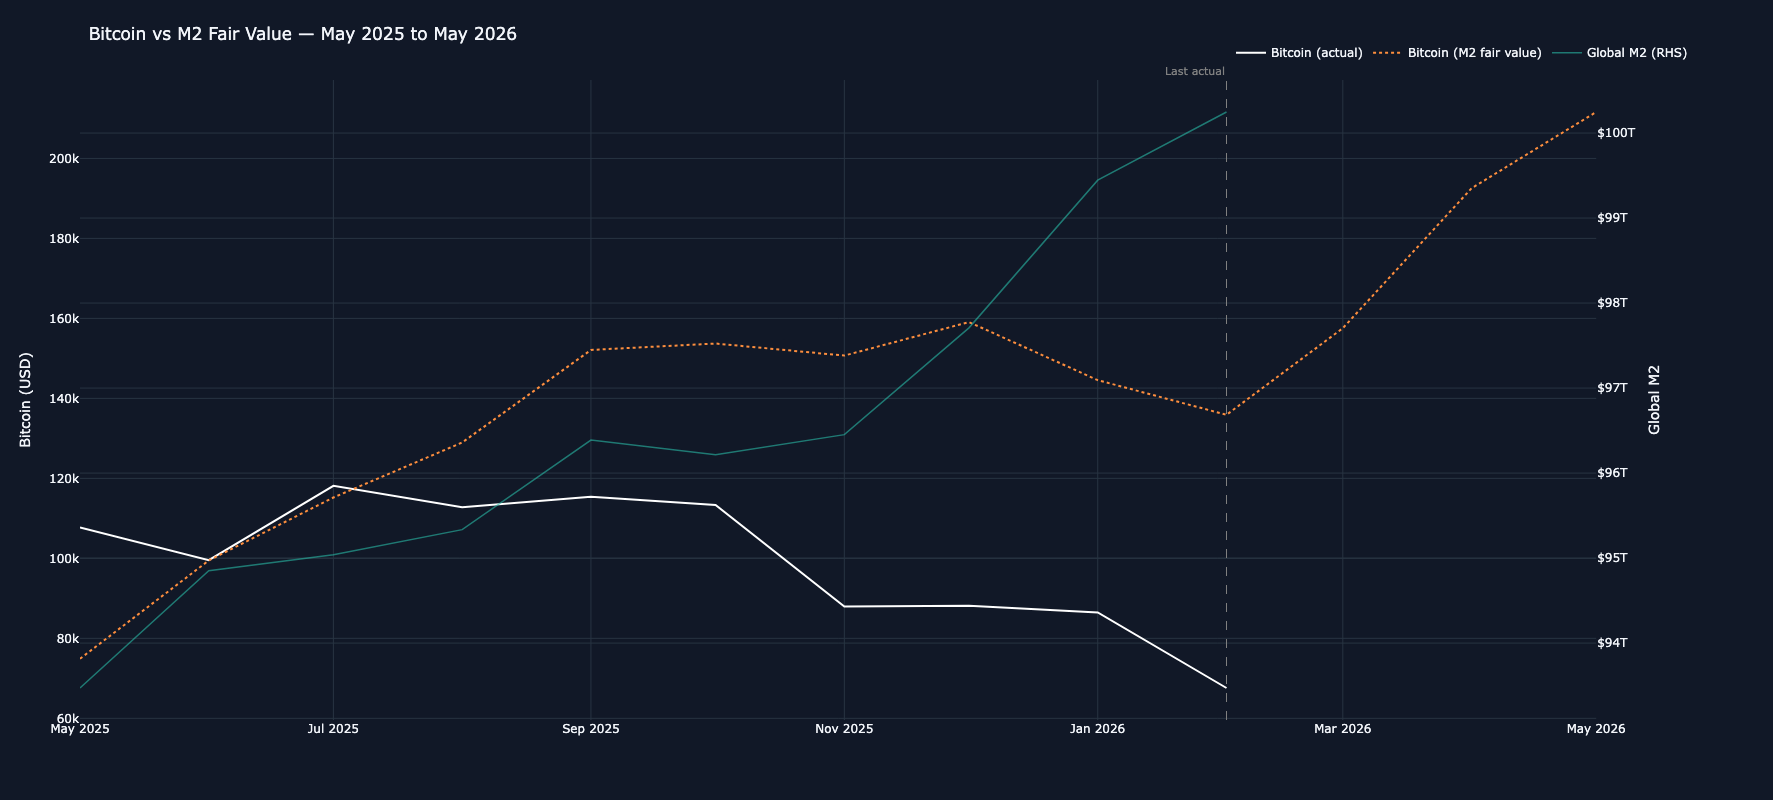
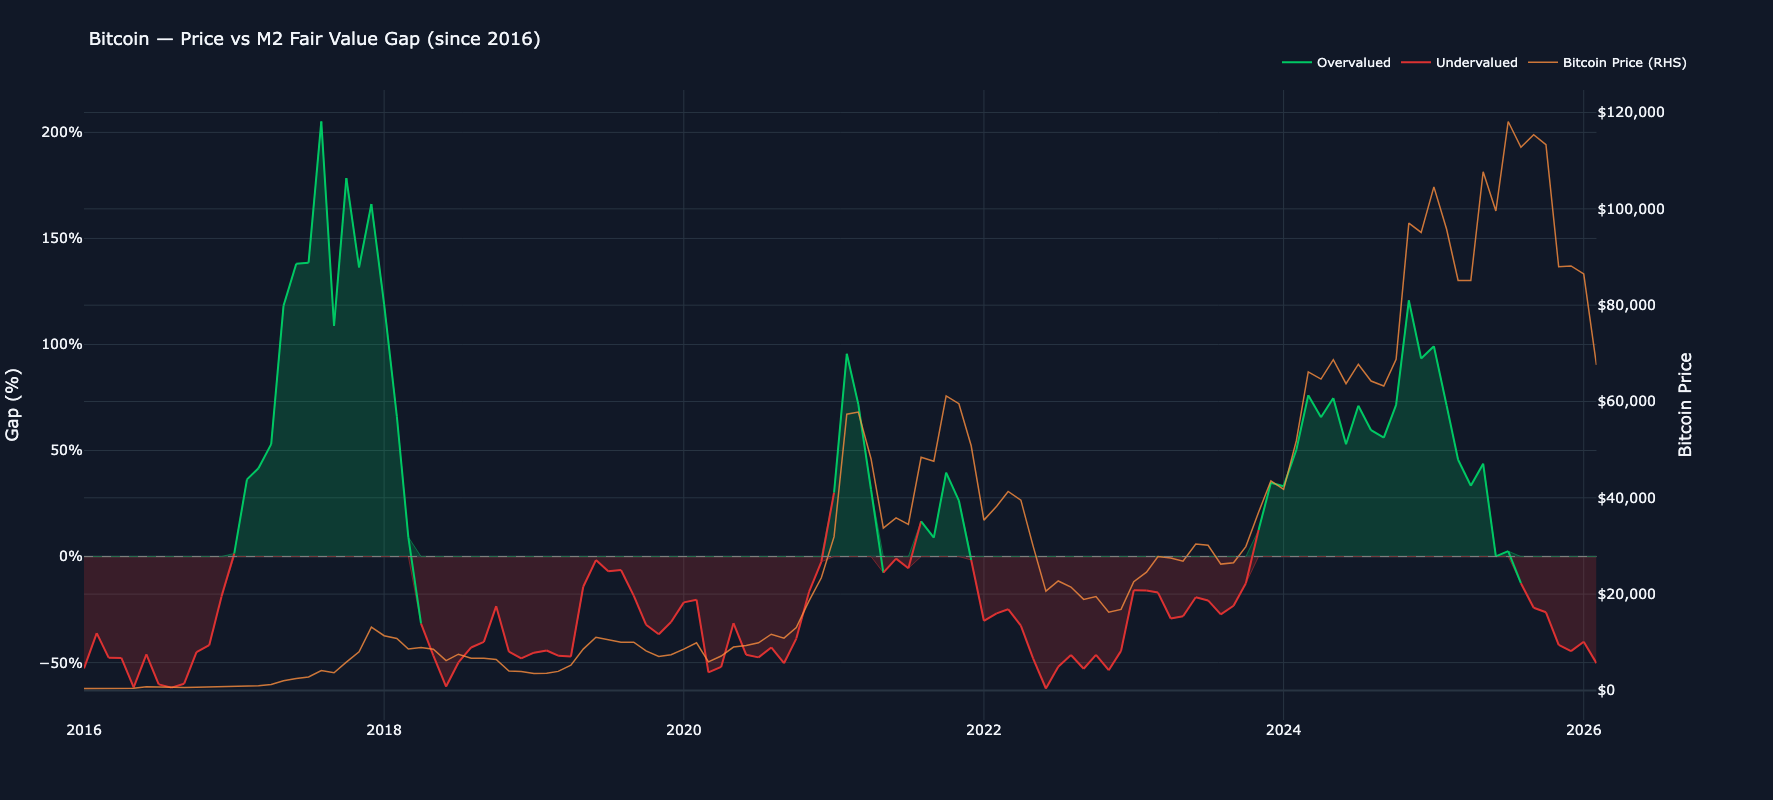
Bitcoin is the outlier. Its M2 beta has remained elevated at roughly 11.3, consistent with its higher volatility profile, but the R-squared has collapsed. During 2022, when M2 was actively contracting, Bitcoin's R-squared ran between 0.71 and 0.90, indicating the liquidity drawdown explained the selloff. Today, with M2 expanding, R-squared has fallen to approximately 0.59. The model generates a fair value near $136,000 against an actual price near $74,000. That gap of roughly 46%, is one of the widest observed in the dataset.
Recessions and Equity Downturns: Divergent Responses
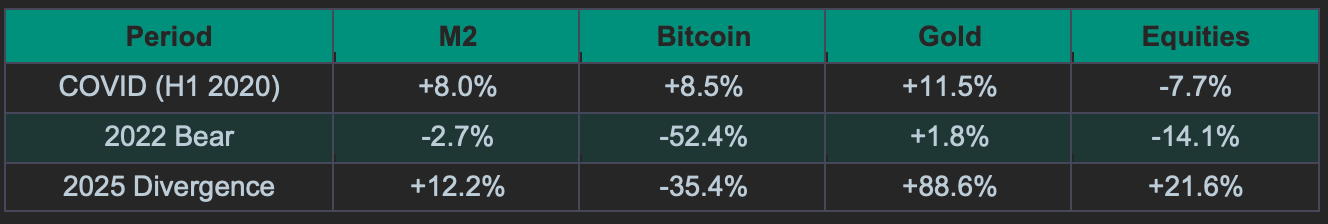
During the COVID crash in early 2020, M2 surged roughly 8% in six months as central banks flooded the system with liquidity. All three assets responded in kind: gold gained 11.5%, Bitcoin gained 8.5%, and global equities recovered to finish the period down only 7.7%. Liquidity expanded, risk assets caught a bid, and the correlations held.
The 2022 bear market offered a mirror image. M2 contracted by 2.7% as the Federal Reserve pursued aggressive quantitative tightening. Bitcoin fell 52.4%, consistent with its high beta to liquidity. Gold managed a modest 1.8% gain while global equities dropped 14.1%. Bitcoin's R-squared with M2 remained high throughout, ranging from 0.71 to 0.90. The liquidity framework accurately explained the drawdown.
The 2025 Divergence Is Different
The current episode does not fit either of those templates. M2 is expanding, yet Bitcoin is declining. Gold and equities are responding to the liquidity backdrop in textbook fashion: gold is up nearly 89% since early 2025, pushing above $5,000 per ounce, while global equities have gained over 21%. Bitcoin alone has moved in the opposite direction, falling from above $104,000 in January 2025 to roughly $68,000 by late February 2026.
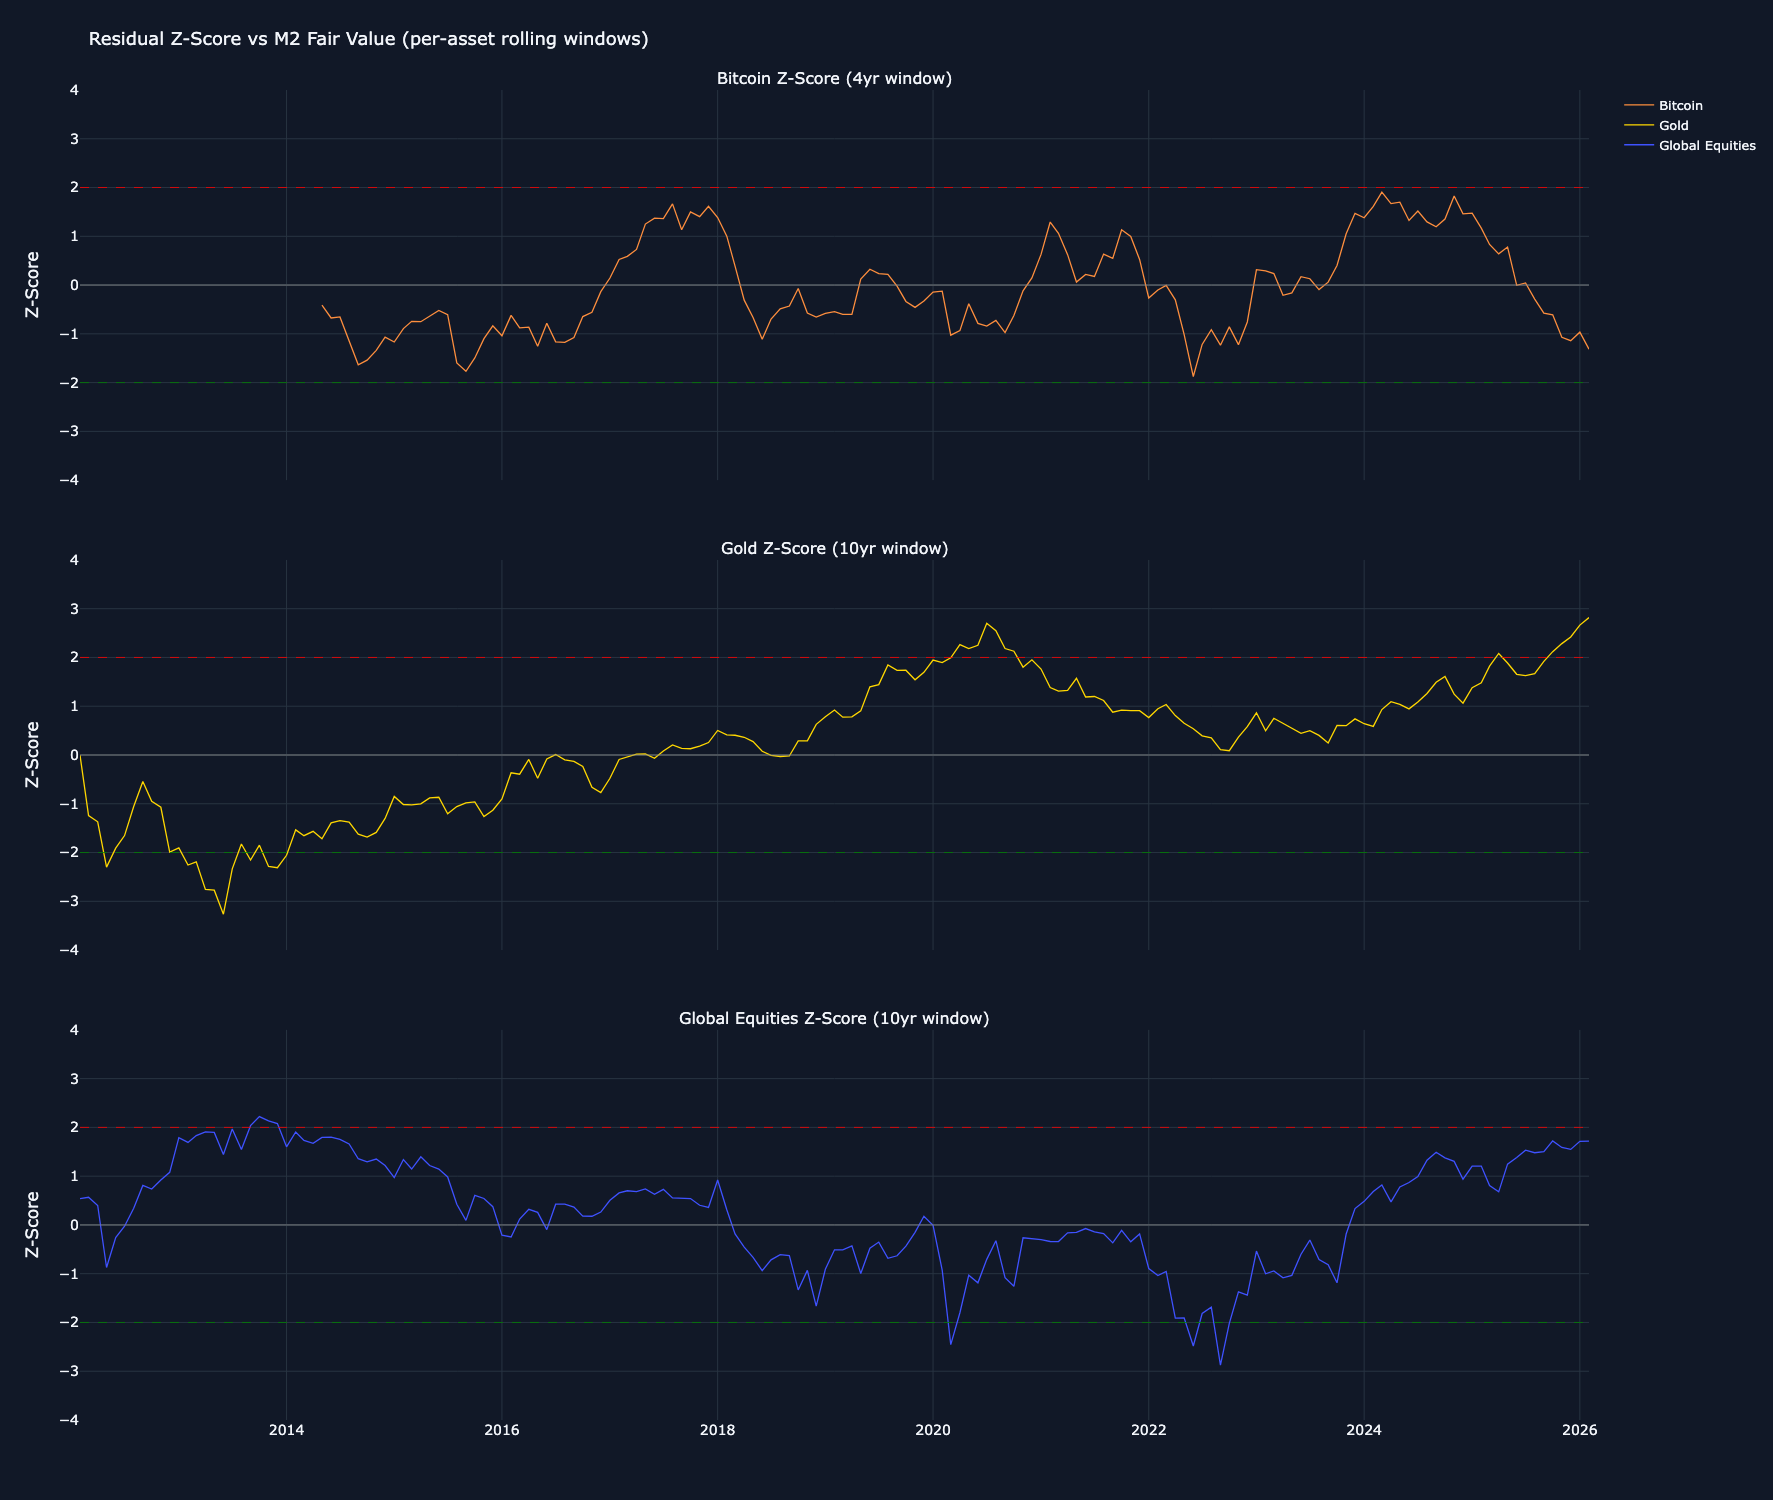
The Z-score data tells the story in quantitative terms. Bitcoin's Z-score relative to its M2 fair value has swung from +1.48 in January 2025, indicating it was trading well above what liquidity conditions would predict, to negative 1.31 by February 2026. Meanwhile, gold's Z-score has climbed from 1.38 to 2.82 over the same period, suggesting it has captured much of the liquidity-driven bid that historically flowed into Bitcoin.
Catalysts for Reconnection
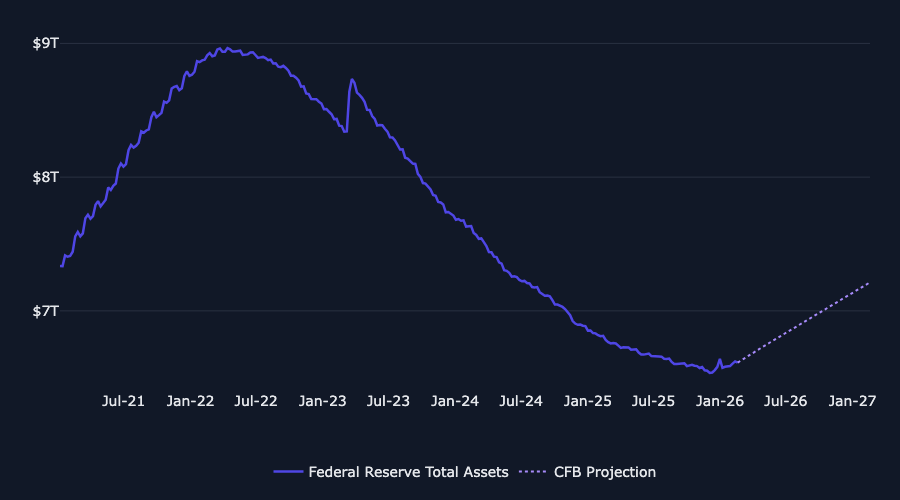
If history is any guide, the M2-Bitcoin relationship does not stay broken for long. The most direct catalyst for reconnection would be a return to balance sheet expansion by the Federal Reserve. The Fed has been in active runoff mode since mid-2022, shrinking its holdings from a peak near $9 trillion to roughly $6.7 trillion as of early 2026. That quantitative tightening has been a persistent headwind for the M2-Bitcoin transmission channel, even as headline M2 has grown through other mechanisms. A pivot back to net asset purchases, whether driven by financial stress, Treasury market dysfunction, or a deliberate policy shift, would inject base money directly into the system and historically has been the single strongest accelerant for the M2-Bitcoin relationship.
A second catalyst would be an improvement in risk appetite, particularly in the technology and growth equity complex. Goldman Sachs data shows that the three-month correlation between Bitcoin ETFs and non-profitable tech stocks reached 0.78, the 97th percentile since December 2014. With over $123 billion in ETF assets by late 2025, Bitcoin's marginal price-setter is now the traditional portfolio allocator. Any rotation back into growth positioning would likely pull Bitcoin along with it, re-anchoring the asset to the liquidity backdrop.
Third, an ETF flow reversal would provide direct mechanical support. U.S. spot Bitcoin ETFs recorded $3.5 billion in net outflows from November 2025 to January 2026, the worst three-month stretch on record. ETF flows have been the primary transmission mechanism between macro conditions and Bitcoin's price since 2024. A sustained return to net inflows, potentially triggered by either of the first two catalysts, could close the feedback loop between M2 expansion and price appreciation.
The Case for Mean Reversion
The central takeaway from two decades of cross-asset data is that M2 divergences with Bitcoin have historically been temporary. The asset's high beta to liquidity means it overshoots in both directions, but over a multi-quarter horizon, price has consistently reverted toward its M2-implied fair value. Our modeling showcases pattern across multiple cycles. We found that every significant gap over the past decade ultimately closed in the direction of the liquidity trend. The current gap, with the model pointing to roughly $136,000 against an actual price near $74,000, represents one of the most extreme dislocations in the dataset and the largest implied catch-up if the historical pattern holds.
The monetary policy backdrop reinforces the mean reversion thesis. The Federal Reserve has maintained a restrictive stance since early 2022, with quantitative tightening running continuously for nearly four years. That posture made sense in the context of elevated inflation, but the macro environment is shifting. The labor market has shown persistent signs of softening, with unemployment claims trending higher and payroll growth decelerating through late 2025 and into 2026. Real GDP growth has slowed meaningfully. If these trends continue, the Fed faces increasing pressure to ease, whether through rate cuts or a return to asset purchases. Each step along that path would increase the velocity of money and strengthen the M2-Bitcoin transmission channel. The historical pattern is clear: when the Fed pivots from tightening to easing, the lag between M2 expansion and Bitcoin's response has been measured in months, not years.
The key risk is that mean reversion is not guaranteed in any single episode. The Nasdaq fell 76.8% from its March 2000 peak despite ample liquidity, because the investor base and narrative both shifted permanently. Our read is that Bitcoin's M2 relationship remains intact as a long-run gravitational force, but it is conditional on the monetary policy and investor risk appetite. The current divergence is wide enough to warrant attention from allocators who are either waiting on the sidelines or underweight.
The information contained within is for educational and informational purposes ONLY. It is not intended nor should it be considered an invitation or inducement to buy or sell any of the underlying instruments cited including but not limited to cryptoassets, financial instruments or any instruments that reference any index provided by CF Benchmarks Ltd. This communication is not intended to persuade or incite you to buy or sell security or securities noted within. Any commentary provided is the opinion of the author and should not be considered a personalised recommendation. Please contact your financial adviser or professional before making an investment decision.
Note: Some of the underlying instruments cited within this material may be restricted to certain customer categories in certain jurisdictions.
Softer CPI Reprices July Hike Risk & Lifts Digital Assets
Digital assets extended their recovery over the past week as cooler US inflation prints repriced Fed expectations; the bid was broad across the large cap indices, growth factor leadership returned, stablecoin funding repriced lower, and stress stayed isolated in names hit by token-specific news.

Mark Pilipczuk
Notice of the Demising of CF Dai-Dollar Settlement Price and Spot Rate
The Administrator announces that it will demise the CF Dai-Dollar Settlement Price (DAIUSD_RR) and CF Dai-Dollar Spot Rate (DAIUSD_RTI) which are members of the CF Digital Asset Index Family.
CF Benchmarks
Addition of the Tether Gold Settlement Price and Spot Rate to the CF Digital Asset Index Family
The Administrator announces the addition of the Tether Gold Settlement Price and Spot Rate to the CF Digital Asset Index Family - Single Asset Series.
CF Benchmarks
By clicking Accept, you consent to CF Benchmarks's use of cookies.
Visit Cookie Settings to learn how CF Benchmarks uses cookies and to adjust your preferences.