
Sep 04, 2026
The Debasement Trade Lifts Nearly Every Corner of the Market
Monthly Attribution - August 2026
The CF Free-Float Broad Cap Index rose 28.84% in August, its strongest month of 2026, after the Treasury’s August 19 decision to double its long-bond buyback program kicked off a debasement trade that carried Bitcoin toward $80,000. Settlement assets contributed 28.31 percentage points of the advance and Bitcoin supplied 19.76 points. Only two of the index’s thirty-two constituents finished lower, and both carried negligible weight in the index.
Market Recap
August’s macro backdrop turned more cautious even as digital assets rallied into it. The Federal Reserve held its policy rate at 3.50% to 3.75% on July 29 by a 9-to-3 vote, the most dissents since September 2016, with three regional presidents pushing for a hike. New Fed Chair Kevin Warsh sharpened that tone at the Jackson Hole symposium on August 28, calling inflation data more concerning than the labor market and lifting September rate-hike odds above 60%. July payrolls fell by 23,000 against an expected 83,000 gain, unemployment eased to 4.1% on falling participation, and core PCE inflation held at 3.3% for a fourth straight month. Renewed tanker attacks in the Strait of Hormuz had already pushed Brent past $105 a barrel in late July, keeping the energy channel to inflation open into August.
The month’s decisive catalyst came from the Treasury, not the Fed. On August 19, the Treasury doubled the maximum size of its long-dated bond buyback operations, in the 10-to-20-year and 20-to-30-year sectors, from $2 billion to at least $4 billion per operation. The move lowered long-term yields and touched off a short squeeze that carried Bitcoin from the low $60,000s to an intraday high of $80,894 on August 25, alongside a broader altcoin advance that added roughly $215 billion to non-Bitcoin market capitalization between August 19 and 22, coinciding with a White House summit with crypto executives and regulators and continued Senate procedural movement on the CLARITY Act market-structure bill. US spot Bitcoin ETFs took in more than $3.52 billion for the month, their strongest total of 2026, while spot Ether ETFs posted their two strongest weekly hauls of the year, $697.18 million and $824 million, in the final two weeks.
Bitcoin gained 26.53% and Ether 35.24% over the period, with Ether’s advance underpinned by both the record ETF demand and continued holder accumulation, as wallets holding between 10,000 and 100,000 ETH added roughly 430,000 ETH over the month. XRP rose 31.97% alongside the broader move, with spot XRP ETFs drawing $110.49 million in the week ended August 28, their strongest week of the year, as Ripple’s RLUSD stablecoin passed $2.07 billion in market capitalization.
Breadth Arrived Wearing Bitcoin’s Weight
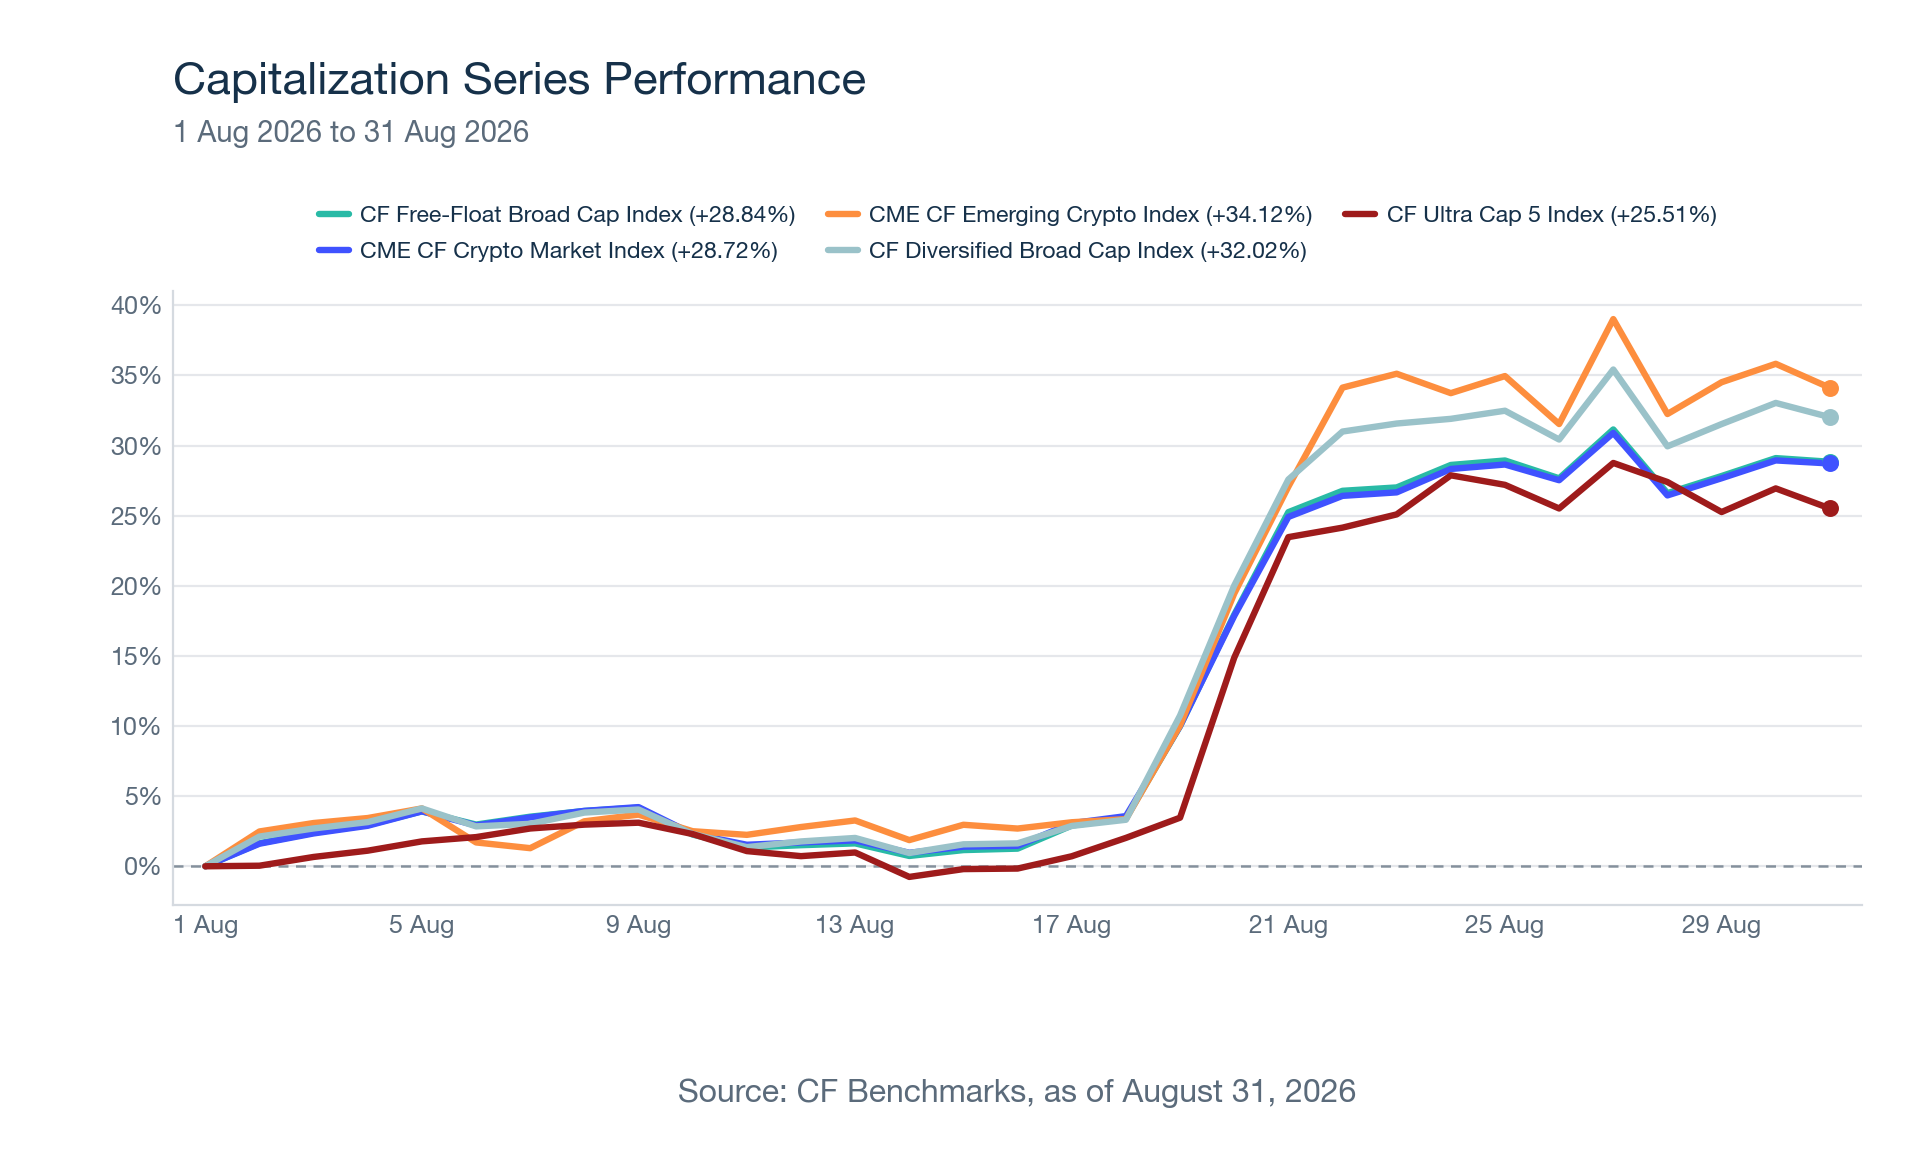
The CF Free-Float Broad Cap Index returned 28.84% over the month, with Settlement assets contributing 28.31 percentage points while Services and Sectors were effectively flat within the basket. Bitcoin alone contributed 19.76% and Ether a further 4.00%, so the two majors supplied roughly 24 points against the 28.84% index return, with XRP adding 1.57% and the rest of the basket filling in the remainder rather than giving any of it back. One level down, the gain sat in Non-Programmable assets at 21.43% and Programmable at 6.88%, with Culture adding 0.22% and no sub-category detracting, Infrastructure the softest at 0.05%. Dispersion across the index suite was directional rather than wide: every flagship index posted a double-digit gain, but the ordering flipped from earlier months, as the CF Diversified Broad Cap Index led at 32.02%, ahead of the CF Free-Float Broad Cap Index’s 28.84% and the CF Ultra Cap 5 Index’s 25.51%, because this month’s rally reached past Bitcoin, Ether, and XRP into names a diversified design holds more of.
Broad Cap: Where the Return Came From
The CF Free-Float Broad Cap Index remains the clearest read on the institutional digital asset opportunity set, and August’s attribution shows how closely a broad, cross-basket rally can still resemble a concentrated one when Bitcoin carries three-quarters of the weight.
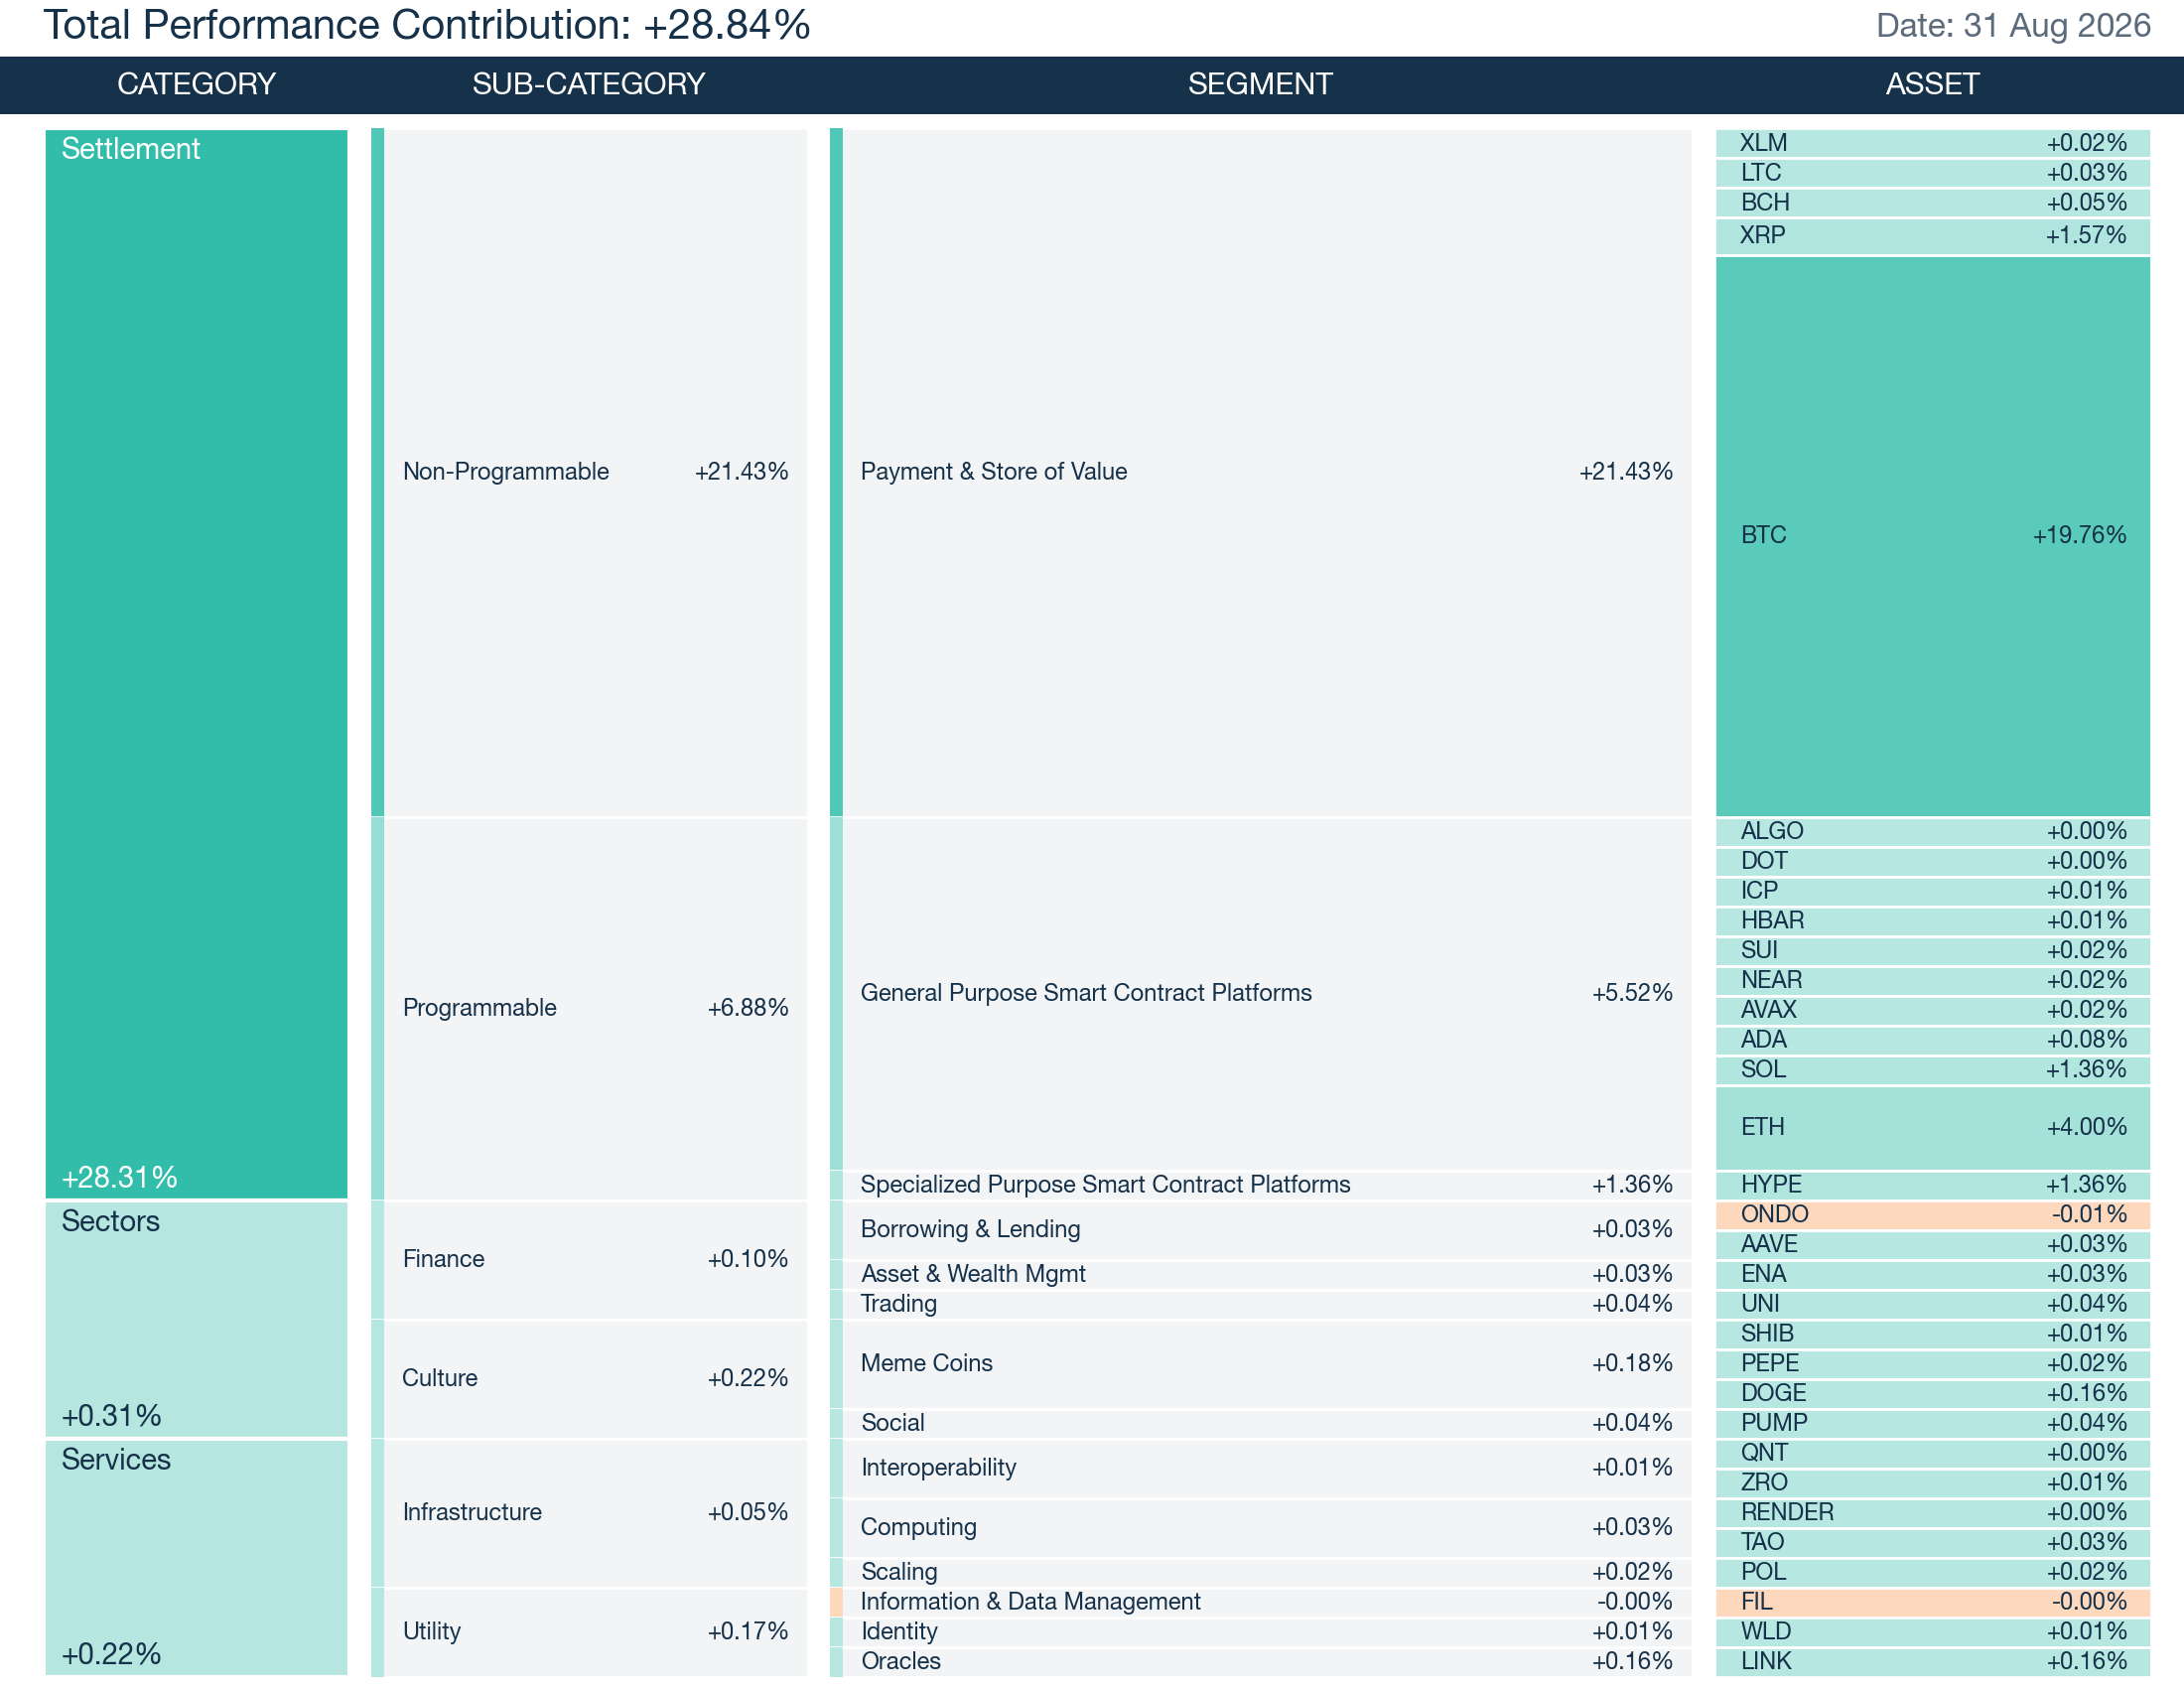
The performance contribution breakdown reinforces the point. Payment & Store of Value drove 21.43% of the return and General Purpose Smart Contract Platforms a further 5.52%, with Specialized Purpose Smart Contract Platforms adding 1.36%. Information & Data Management was the only segment to detract, and its contribution was too small to matter. Ether contributed 4.00% and XRP 1.57%, so Bitcoin, Ether, and XRP together supplied roughly 25 points of the 28.84% return, each carrying a distinct catalyst inside a single risk-on tape: Bitcoin the Treasury’s buyback-driven debasement trade, Ether a record month of ETF inflows and continued holder accumulation, and XRP the broader market advance alongside its own ETF demand.
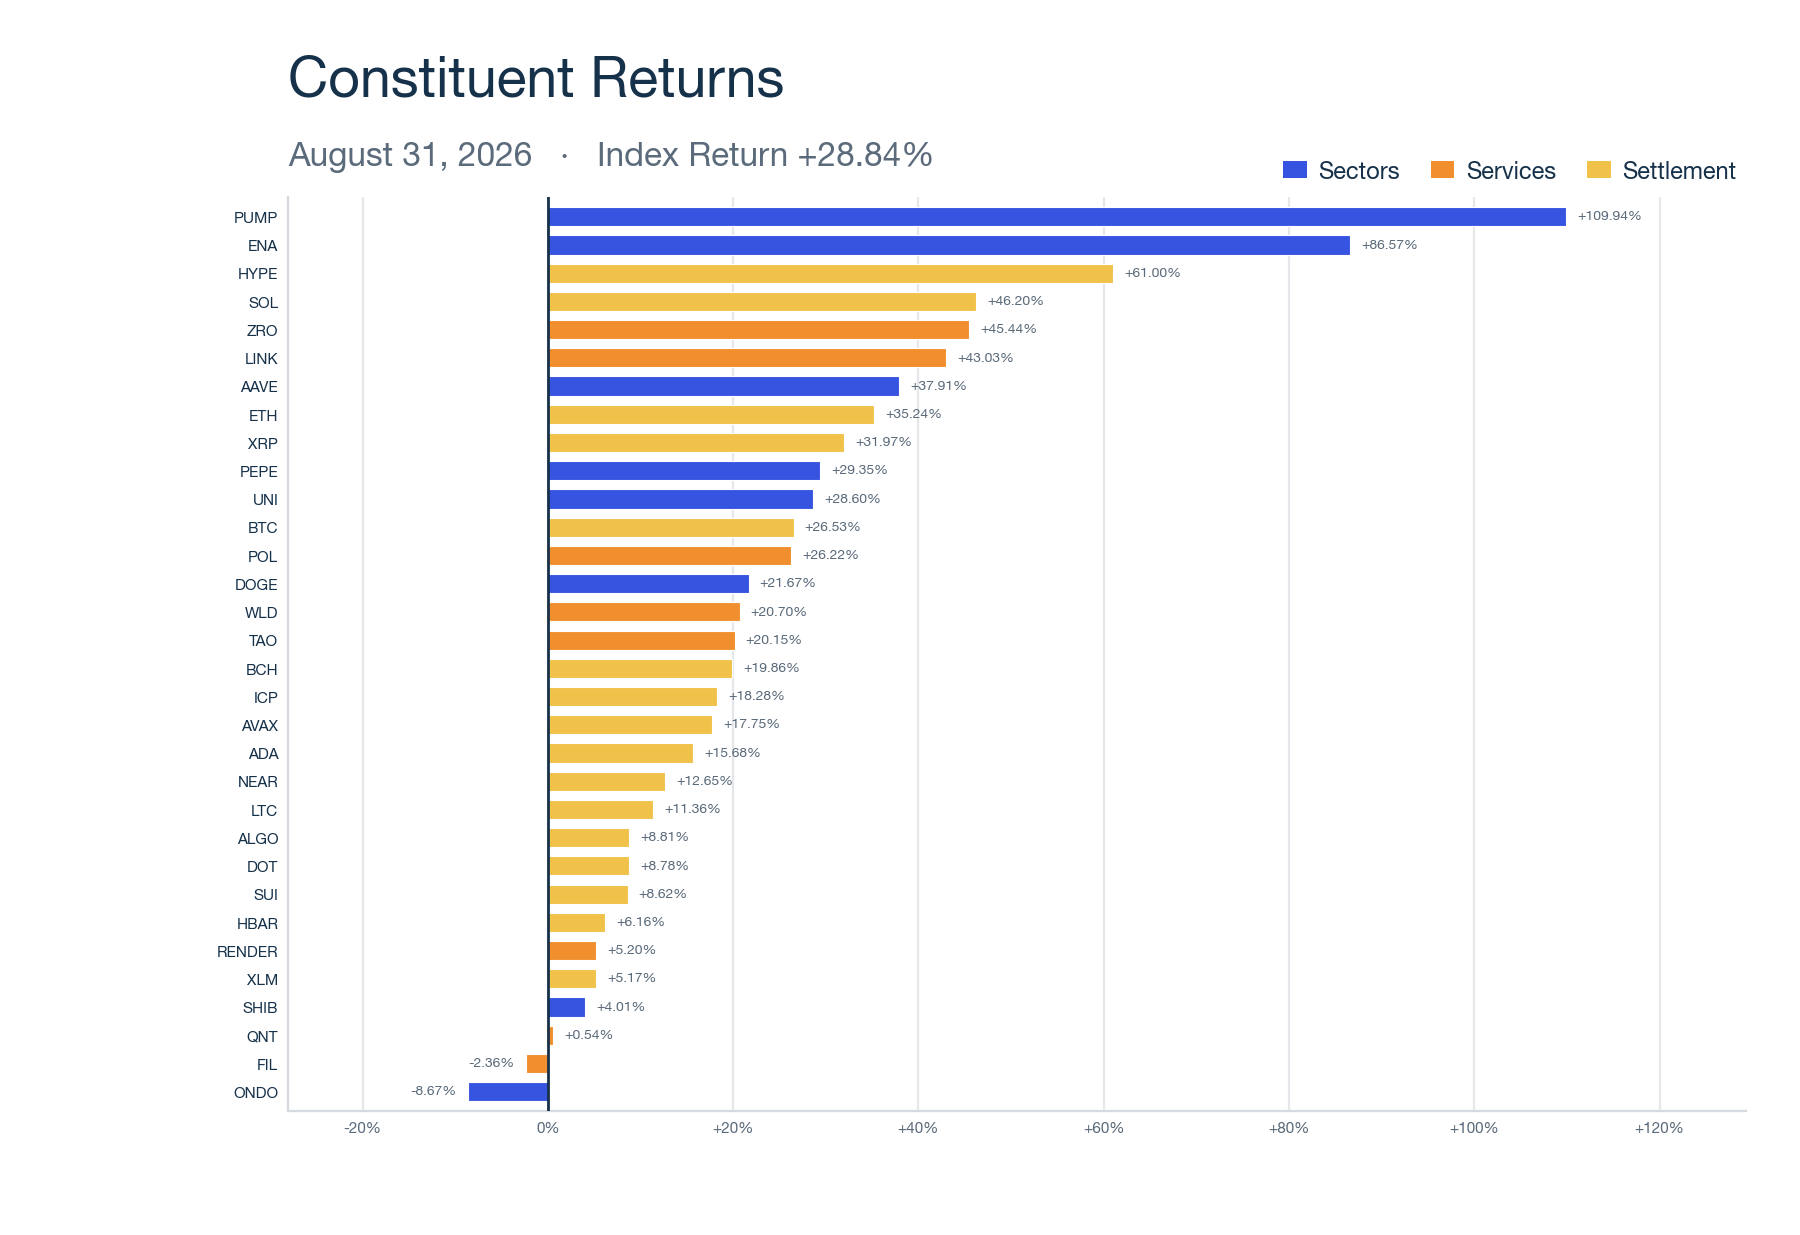
Constituent-level dispersion ran wide, but the direction was almost universal. Pump.fun led the index at 109.94%, riding the same risk-on tape that carried the majors higher. Ondo Finance was the sole detractor of note, its token falling 8.67% but its light starting weight limiting the cost to just 0.01% of the index return. Only two of the index’s thirty-two constituents finished August lower, and both were negligible, a sharp contrast with July’s eighteen decliners on a much smaller index gain.
Across the Capitalization Series
The mega-cap CF Ultra Cap 5 Index returned 25.51%, a strong month but the softest of the three capitalization benchmarks this time. Bitcoin and XRP accounted for 80% of the gain between them, with Bitcoin’s 78.93% weight driving 18.88 points of the total and XRP adding 1.49% on a 5.23% weight. Ether contributed 3.77% on a 12.15% weight, actually outpacing Bitcoin’s own return, 31.04% against 23.92%, without moving the total much given its smaller weight. Solana added 1.30% and Cardano just 0.065%, the smallest and only immaterial holding; every one of the five constituents finished the month higher, so the top-five, no-diversification design captured the rally in full without giving any of it back.
The CF Diversified Broad Cap Index rose 32.02%, the strongest of the three capitalization benchmarks, a reversal from months when its capped Bitcoin position left it trailing. With Bitcoin holding only about 40% of this basket’s weight against Free-Float’s 74.49%, the even weighting let Hyperliquid and Solana’s larger idiosyncratic gains contribute nearly as much as XRP, spreading the rally beyond the three largest names. Bitcoin still contributed 10.74% and Ether 7.35%, the basket’s two biggest drivers, but the broader weighting captured more of August’s rally than either the free-float or mega-cap designs, the opposite of the pattern that held the diversified structure at the back of the series in prior months.
Across the Classification Series
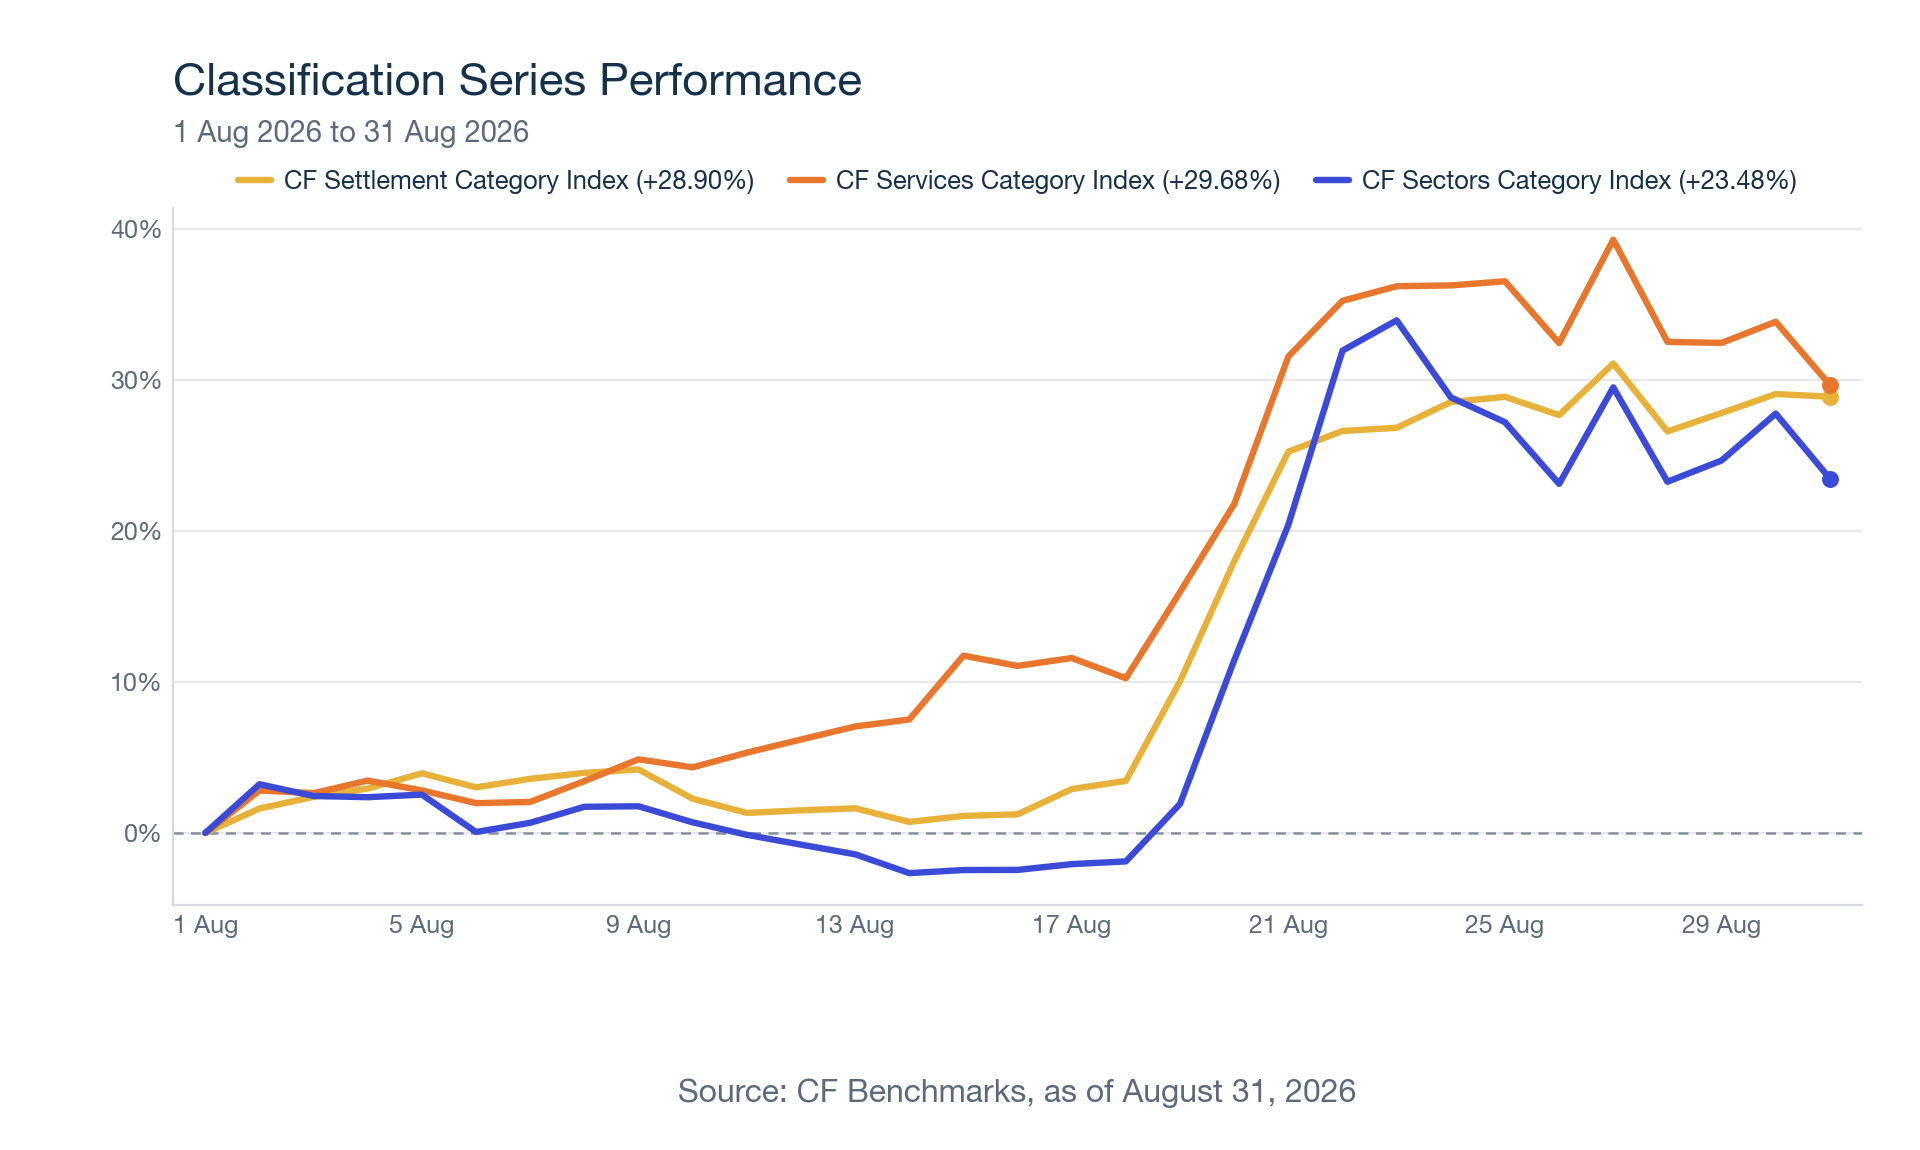
The CF Services Category Index led the three CF DACS category indices this month, at 29.68%, ahead of the CF Settlement Category Index’s 28.90% and the CF Sectors Category Index’s 23.48%, a different order than the Bitcoin-driven months earlier in the year. Chainlink’s month-long run of institutional integrations, a Bank of England settlement demo, Standard Chartered’s coverage initiation, and Coinbase naming it oracle infrastructure for its Tokenized Stocks on Base, drove 20.71% of the Services index’s return on its own, with Filecoin the lone detractor at -0.08%. The CF Settlement Category Index tracked Bitcoin’s 20.18% contribution almost mechanically, though the advance was broad within the category: all sixteen constituents rose. The CF Sectors Category Index, still a strong month in isolation, drew 11.95% from Dogecoin’s broad-market ride higher rather than a token-specific catalyst, against a lone detraction from Ondo Finance at -0.44%.
To read the full reports, please click on the respective links below:
CF Free-Float Broad Cap Index: Monthly Attribution [PDF]
CF Diversified Broad Cap Index: Monthly Attribution [PDF]
CF Ultra Cap 5 Index: Monthly Attribution [PDF]
CME CF Crypto Market Index: Monthly Attribution [PDF]
CME CF Emerging Crypto Index: Monthly Attribution [PDF]
CF Settlement Category Index: Monthly Attribution [PDF]
CF Services Category Index: Monthly Attribution [PDF]
CF Sectors Category Index: Monthly Attribution [PDF]
Our Monthly Attribution Reports are designed to help investors understand the performance of digital assets through a purpose-centric lens called the CF Digital Asset Classification Structure (CF DACS). To learn more about CF DACS, please use our interactive CF DACS Token Explorer.
The information contained within is for educational and informational purposes ONLY. It is not intended nor should it be considered an invitation or inducement to buy or sell any of the underlying instruments cited including but not limited to cryptoassets, financial instruments or any instruments that reference any index provided by CF Benchmarks Ltd. This communication is not intended to persuade or incite you to buy or sell security or securities noted within. Any commentary provided is the opinion of the author and should not be considered a personalised recommendation. Please contact your financial adviser or professional before making an investment decision.
Note: Some of the underlying instruments cited within this material may be restricted to certain customer categories in certain jurisdictions.
Launch of the CF HODLife HARD Index
The Administrator announces the launch of the CF HODLife HARD Index, a co-branded benchmark developed by CF Benchmarks and HODLife, an insurance technology company.

Mark Pilipczuk
Changes to the Token Market Price Benchmarks Series - Market Prices – 13 October 2026
The Administrator has confirmed changes to the Token Market Price Family for the period 06 October 2026 to 13 October 2026
CF Benchmarks
Notice of the Demising of Certain CF Spot Rates
The Administrator announces that it will demise the CF Storj-Dollar Spot Rate (STORJUSD_RTI) and CF Badger DAO-Dollar Spot Rate (BADGERUSD_RTI) which are members of the CF Digital Asset Index Family
CF Benchmarks
By clicking Accept, you consent to CF Benchmarks's use of cookies.
Visit Cookie Settings to learn how CF Benchmarks uses cookies and to adjust your preferences.