
Jun 02, 2025
Suitcoiners
The irony of Bitcoin volatility, apparently, transitioning to a far less aggressive phase than its widely recognized historical profile, during one of the most tumultuous geopolitical and U.S. political climates seen for several decades, is lost on no one paying attention. It’s a theme we’ve zoomed in on quite a bit around here lately.
Now, further corroboration is emerging in the form of startling data on Bitcoin’s most deeply entrenched foothold in the mainstream marketplace. That foothold is of course BlackRock’s iShares Bitcoin Trust ETF (IBIT), which utilizes our CME CF Bitcoin Reference Rate - New York Variant (BRRNY) as its benchmark.
IBIT is the largest spot Bitcoin ETF by assets in terms of assets under management (AUM). This arguably makes BRRNY the single most ‘systemically significant’ regulated crypto index, based on the volume of assets referencing it.
The volume of those assets stands above $72.4bn at the time of writing, having sprinted through the latest of several remarkable phases of expansion since IBIT was listed among the first brace of U.S. spot crypto ETFs in January 2024. (For a comparison, IBIT is now on a similar footing, in AuM terms, with the Invesco S&P 500® Equal Weight ETF. That holds assets of $73.5bn, having listed in April 2003).
The additional $6.4 billion IBIT amassed in May, another record monthly rate for the fund, places it among the fastest growing ETFs of the month invested in any asset class.
Bitcoin’s most recent apex is one obvious corollary. The BRR variant of CF Benchmarks’ Reference Rate, which supplies Bitcoin’s most trusted institutional price at the traditional London market close, 4 pm, notched the new record high at $110,941.32 on May 22nd. (Note, these regulated reference prices now span several time zones (BRR, BRRNY, BRRAP).
The peak followed an unequivocal updraft commencing April 9th; the date on which the White House announced a 90-day pause on the imposition of reciprocal tariffs.
Trump’s temporary tariff retreat also appears to have been the cue for the latest surge in demand for IBIT, quantifiably from institutional investors, according to a market structural expert quoted by Bloomberg here. The torrent may have received additional impetus late in the month as it emerged in recent days the US Court of International Trade was not inclined to endorse the propriety of ‘Liberation Day’ tariffs, though the ruling was temporarily suspended a day later at Federal court level.
IBIT vol. follows BTC's lower
Either way, this institutionalized FOMO is going hand in hand with cratering IBIT volatility, aligned with tamer variance observed in the underlying over the last few months.
IBIT’s 90-day rolling realized volatility has, like that of Bitcoin, been trending lower since the 90-day ‘pause’, to stand at its lowest ever by Friday night, at 46.48.
As Bloomberg’s Eric Balchunas points out, the tendency is for the relationship between the two metrics to behave like a flywheel under such conditions:
"The lower the volatility gets, the more bigger investors will bite who will help lower volatility even more. The same 'should' happen with correlation too. This is a direct result of the ‘suitcoiners.’”
Senior Bloomberg ETF Analyst, Eric Balchunas, quoted in Coindesk.
The day before, on X / Twitter, Balchunas, suggested these so-called ‘suitcoiners’ are seeking “digital gold, not a tech stock”; i.e., they’re looking for a way to capture the upside and defensive characteristics of the safe haven asset, gold, rather than chasing the other hypothesized guise of Bitcoin, its characterization as an asset analogous to a ‘FANGMA’ stock. (Ironically, of course, not all of those have been consistently more volatile than gold in recent years).
'Two Golds'
Regardless, Balchunas' observations do allude to a potential shift of the demand distribution between funds investing in 'the two golds'.
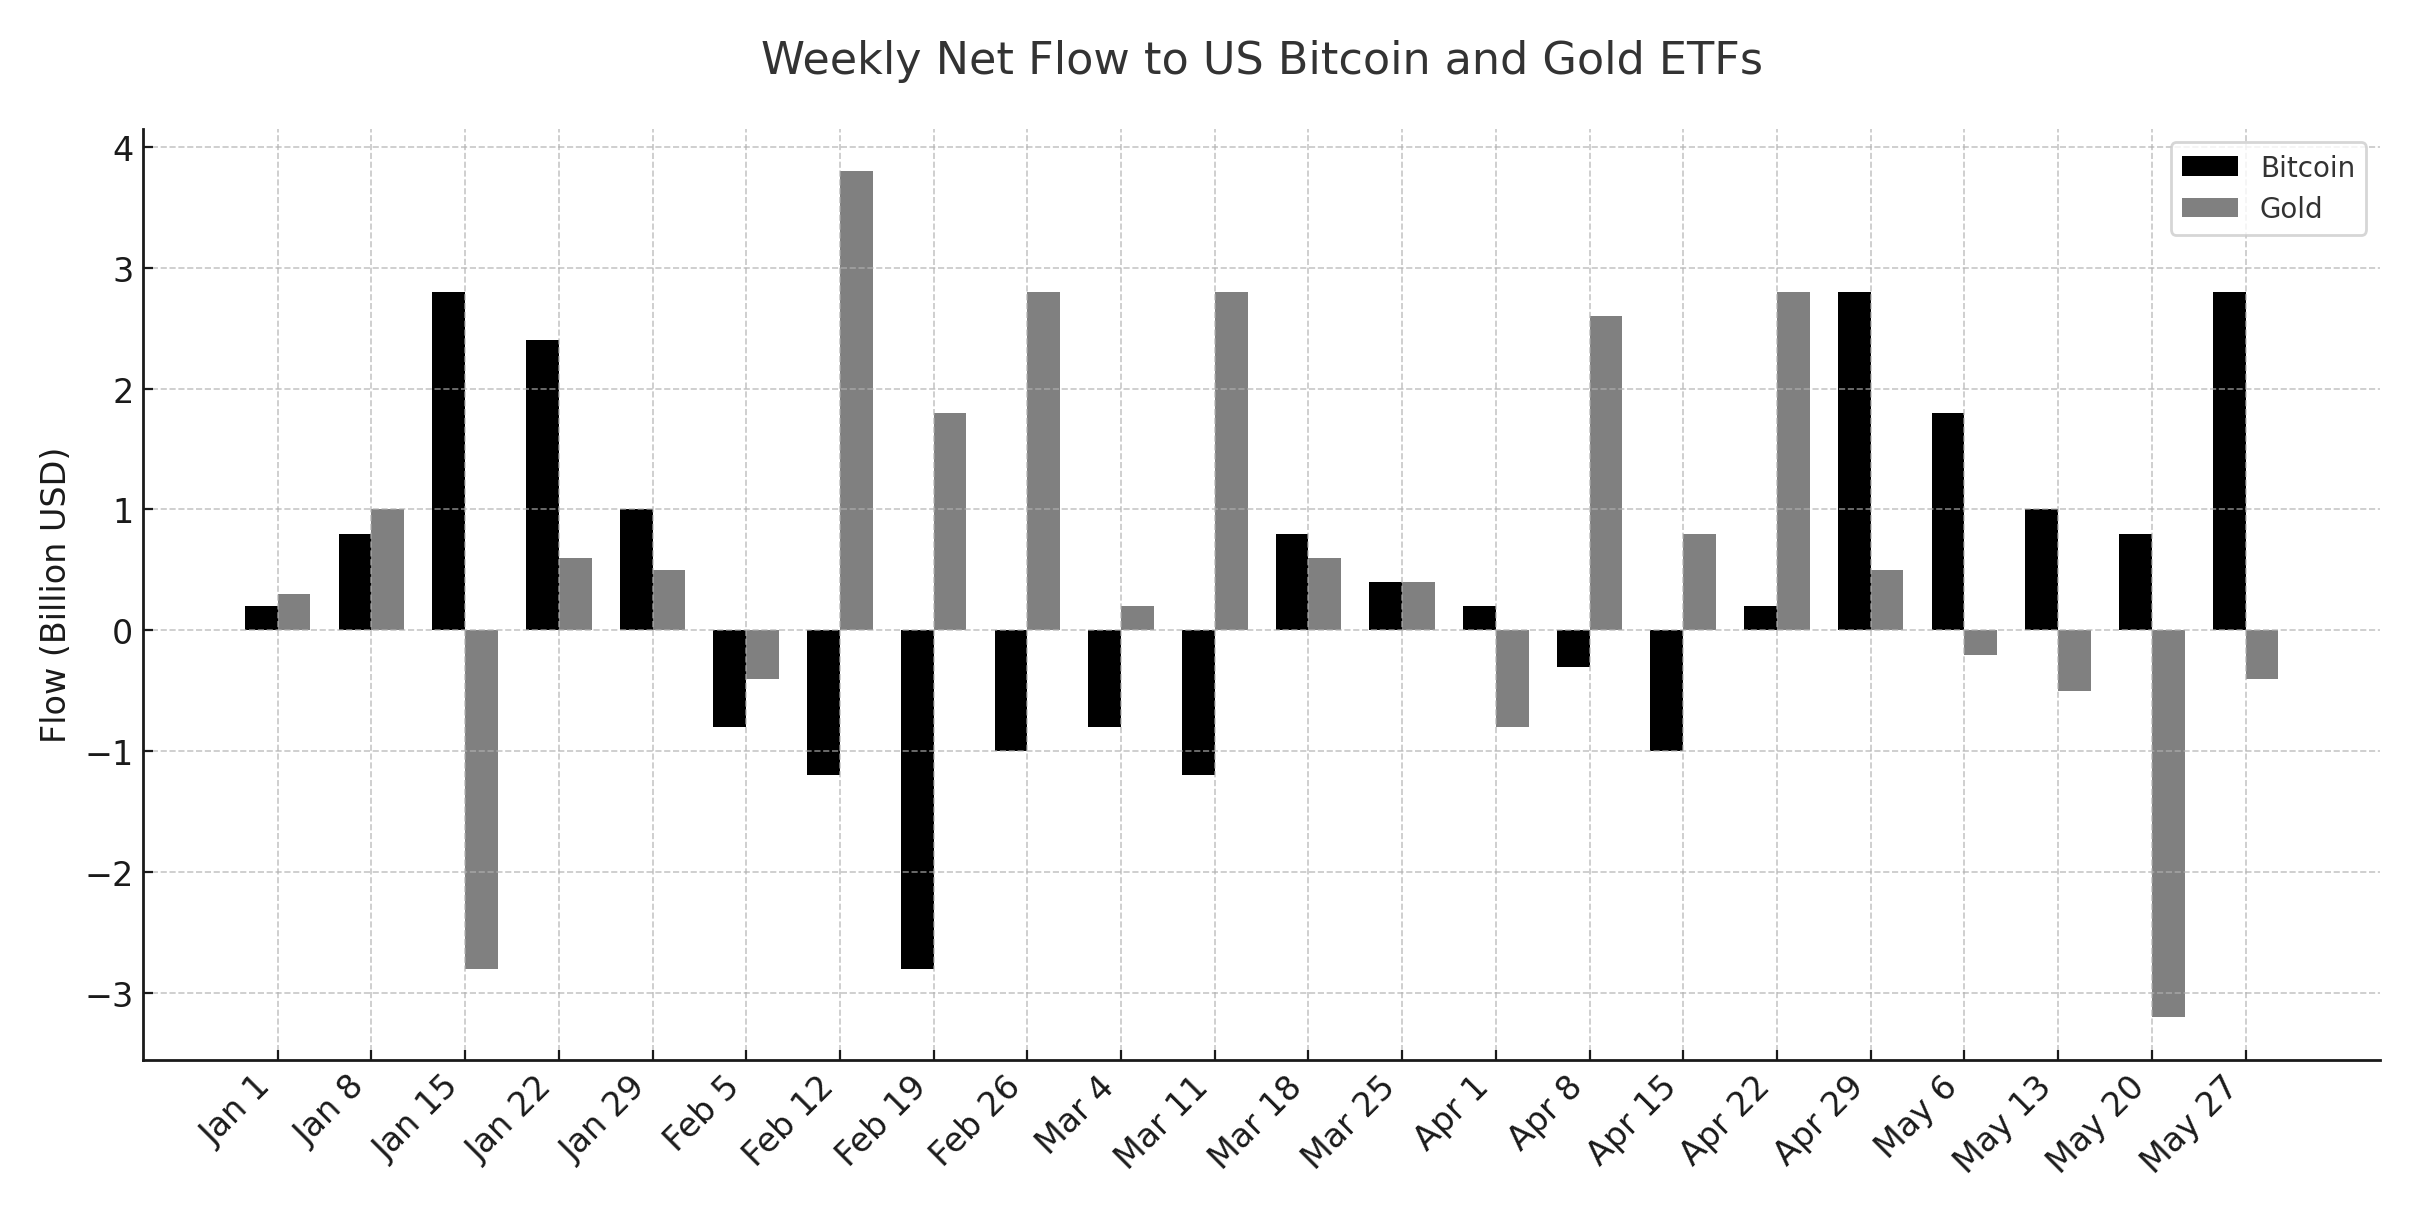
What’s generating that intrigue is that even with gold over 25% higher so far this year, the last several weeks have seen the typical pattern of gold and bitcoin fund flows – which of course usually favor the precious metal – flip.
As noted by this piece, and illustrated below, more than $2.8bn was drained from U.S. gold ETFs tracked by Bloomberg over the last five weeks. That compares with the $9bn which flowed into U.S. Bitcoin ETFs over the same period.
Five weeks of data don’t represent a paradigm shift. However, they do model what the ideological switch in investing perspectives long sought after and speculated by a tranche of Bitcoin proponents might look like, if sustained. We’ll need to check in on this hypothesis again, in more like 5 years, to know for sure.
What’s clearer already though, from readings like the recent gold/bitcoin ETF flows balance, tumbling IBIT volatility, and resurgent IBIT assets, is that institutional appetite for ‘digital gold’ cuts through the cycle in ways which were previously less certain.
There’s now even less doubt the institutional investment sphere has crossed a major Rubicon.
The information contained within is for educational and informational purposes ONLY. It is not intended nor should it be considered an invitation or inducement to buy or sell any of the underlying instruments cited including but not limited to cryptoassets, financial instruments or any instruments that reference any index provided by CF Benchmarks Ltd. This communication is not intended to persuade or incite you to buy or sell security or securities noted within. Any commentary provided is the opinion of the author and should not be considered a personalised recommendation. Please contact your financial adviser or professional before making an investment decision.
Note: Some of the underlying instruments cited within this material may be restricted to certain customer categories in certain jurisdictions.
Changes to the Token Market Price Benchmarks Series - Market Prices – 21 July 2026
The Administrator has confirmed changes to the Token Market Price Family for the period 14 July 2026 to 21 July 2026.

CF Benchmarks
Softer CPI Reprices July Hike Risk & Lifts Digital Assets
Digital assets extended their recovery over the past week as cooler US inflation prints repriced Fed expectations; the bid was broad across the large cap indices, growth factor leadership returned, stablecoin funding repriced lower, and stress stayed isolated in names hit by token-specific news.
Mark Pilipczuk
Notice of the Demising of CF Dai-Dollar Settlement Price and Spot Rate
The Administrator announces that it will demise the CF Dai-Dollar Settlement Price (DAIUSD_RR) and CF Dai-Dollar Spot Rate (DAIUSD_RTI) which are members of the CF Digital Asset Index Family.
CF Benchmarks
By clicking Accept, you consent to CF Benchmarks's use of cookies.
Visit Cookie Settings to learn how CF Benchmarks uses cookies and to adjust your preferences.