
Sep 11, 2022
Quarterly Attribution Analysis: CF Digital Culture Composite Index
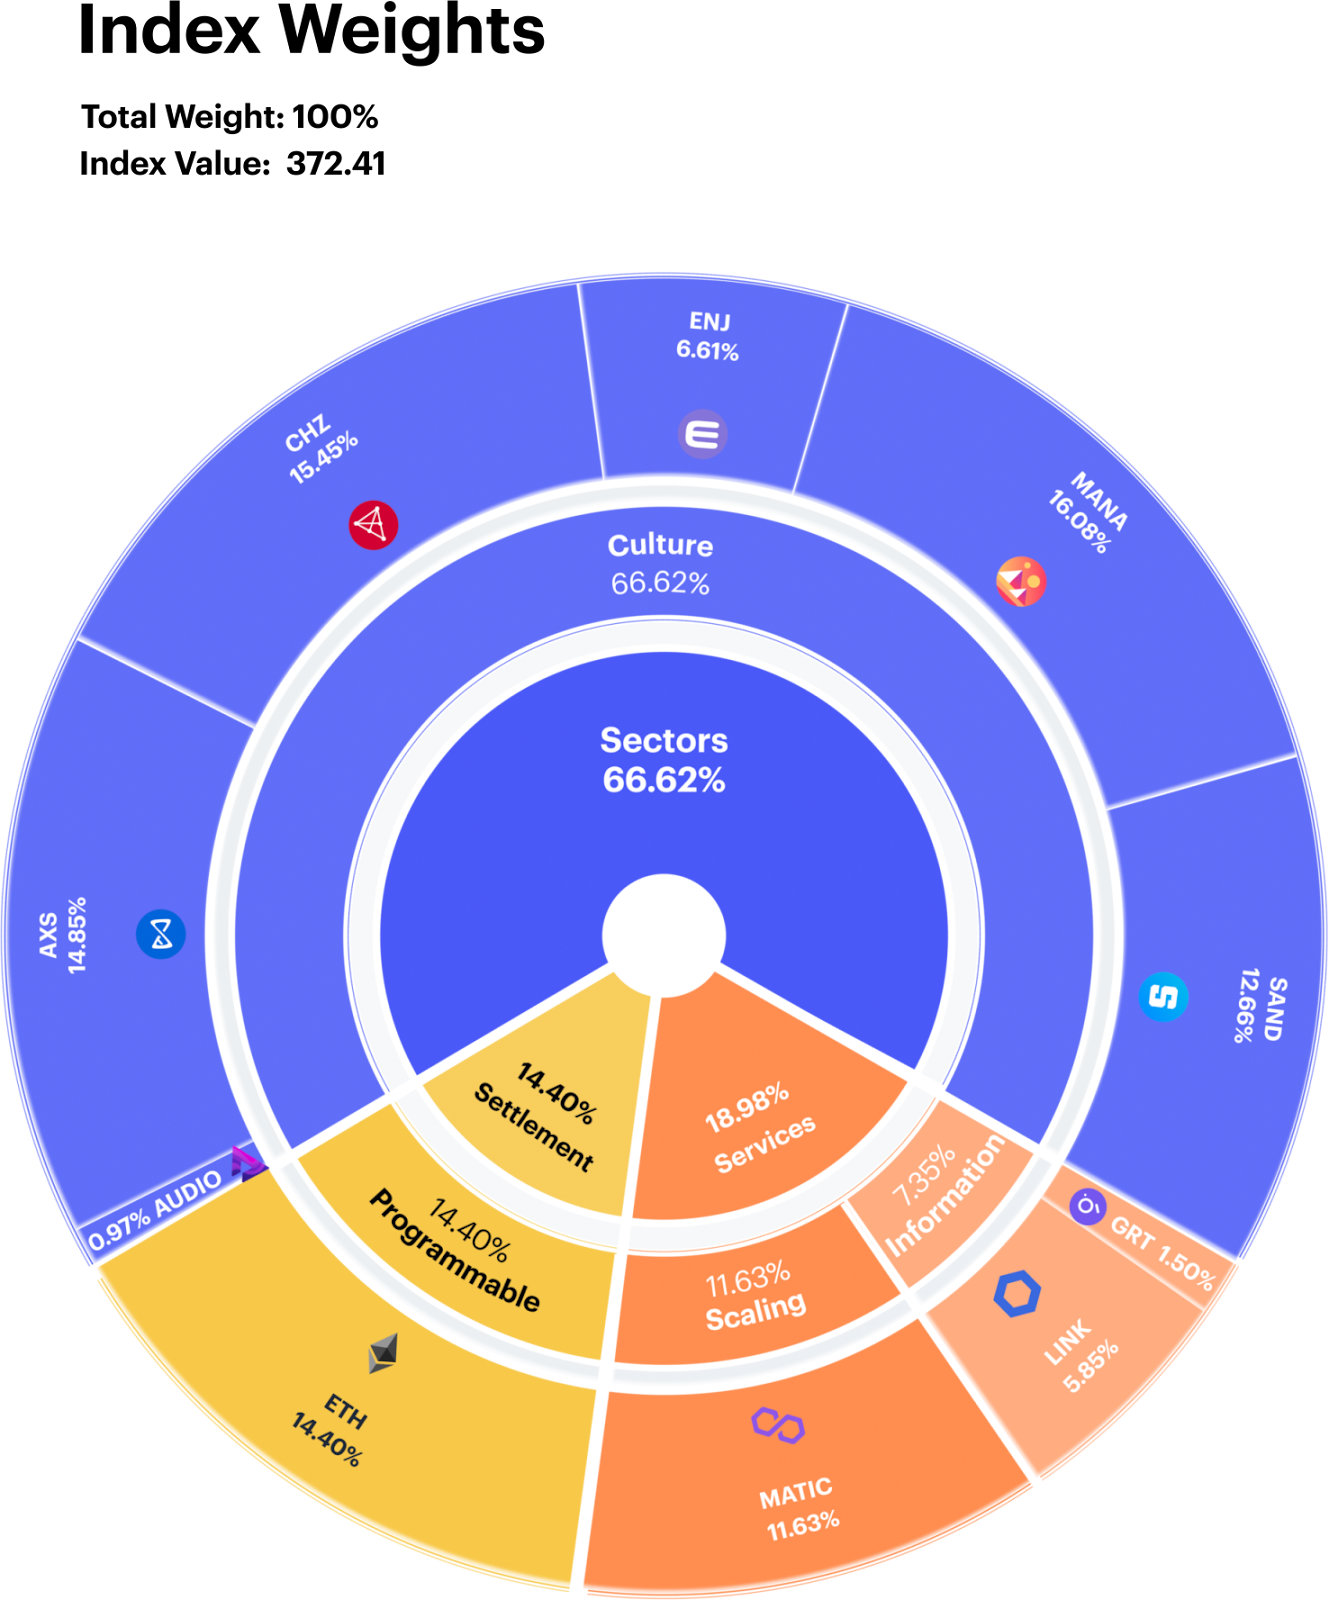
The CF Digital Culture Composite Index - is a liquid, investible benchmark portfolio index that tracks the return performance of protocols involved in the digitization and tokenization of cultural experiences and artefacts including the Metaverse, NFTs, Gaming, and Music. The index is comprised of three distinct sub-portfolios of fixed weight that represent the components of blockchain architecture that are required to deliver the digitised culture to individual and institutional end users; Digital Culture Applications, Services and Settlement Blockchains. Digital assets are classified in accordance with the CF Digital Asset Classification Structure (DACS) for sub-portfolio eligibility. Digital assets are weighted by free float market capitalisation within each sub-portfolio in accordance with the CF Digital Asset Series Ground Rules and the index methodology. The index is calculated and published once a day at 4:00 pm London Time. It is reconstituted on a twice yearly basis and rebalanced quarterly. The CF Digital Culture Composite Index - London was incepted on February 1st 2022 with a value of 1,000.
Digital Culture Begins to Bottom in the Macro Storm
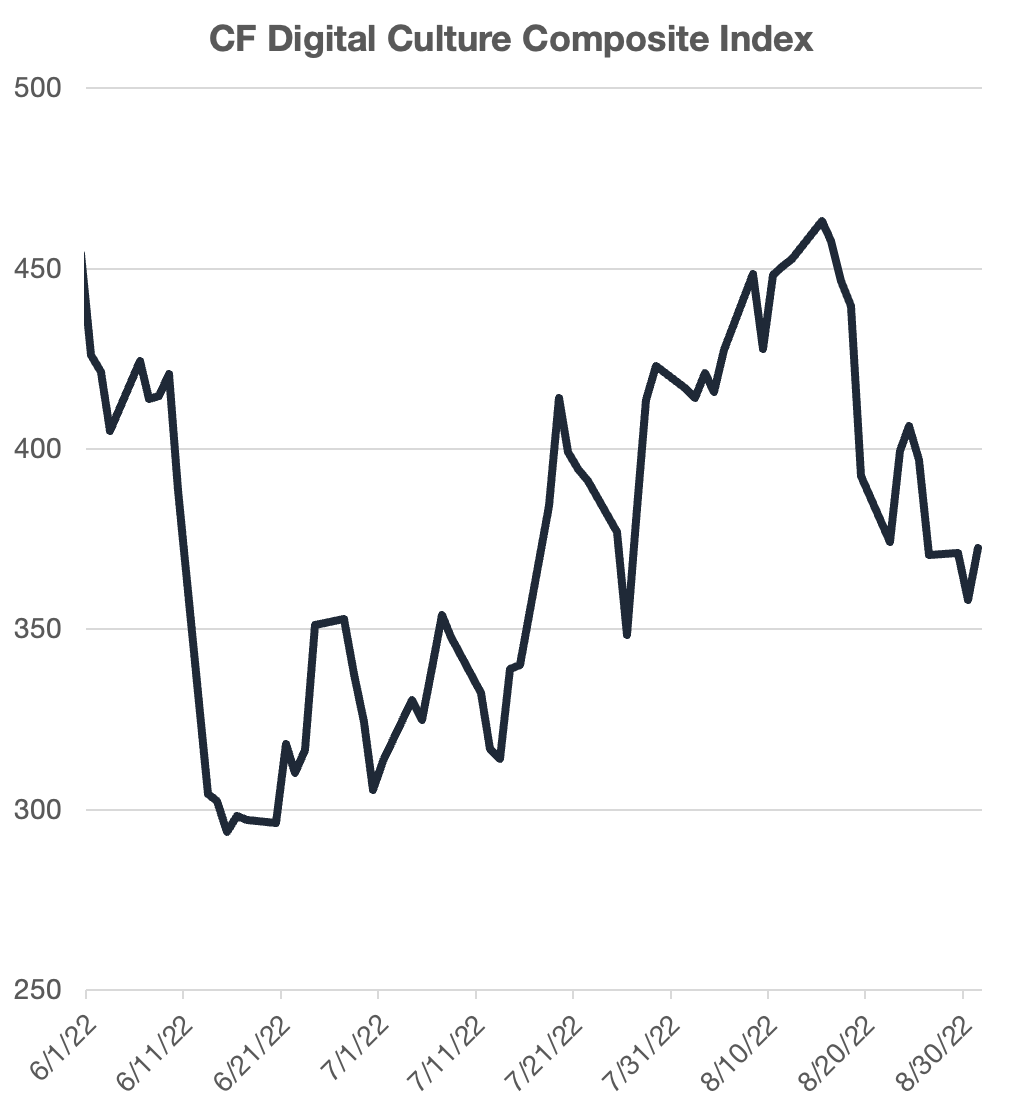
The challenging macroeconomic environment continued for digital assets: inflation remains at multi-decade highs, central banks are making sizeable policy rate increases, and global growth has begun to stall. Meanwhile, the CF Digital Culture Index has fallen -12.5% over the course of our most recent rebalancing period, leaving the index approximately 66% below its March all time highs. Markets have remained vulnerable to increases in central bank policy rates that has led to a tightening of financial conditions in an effort to stymie inflation in most developed market economies. Although this dynamic has been visible across most risky assets, such as equities, the naturally higher volatility in the digital asset space has amplified downside price action.
Tokens in the Digital Culture index have followed the overall negative trend in crypto markets. However, it is worth noting that the Culture segment has been a relative laggard when compared to other segments in our Digital Asset Classification Structure (DACS). The more aggressive selling pressure that occurred earlier in the year has now led to a quicker bottoming pattern for token prices in the segment. In turn, this has been relatively supportive for the segment over the past rebalancing period.
Scaling Stands Out
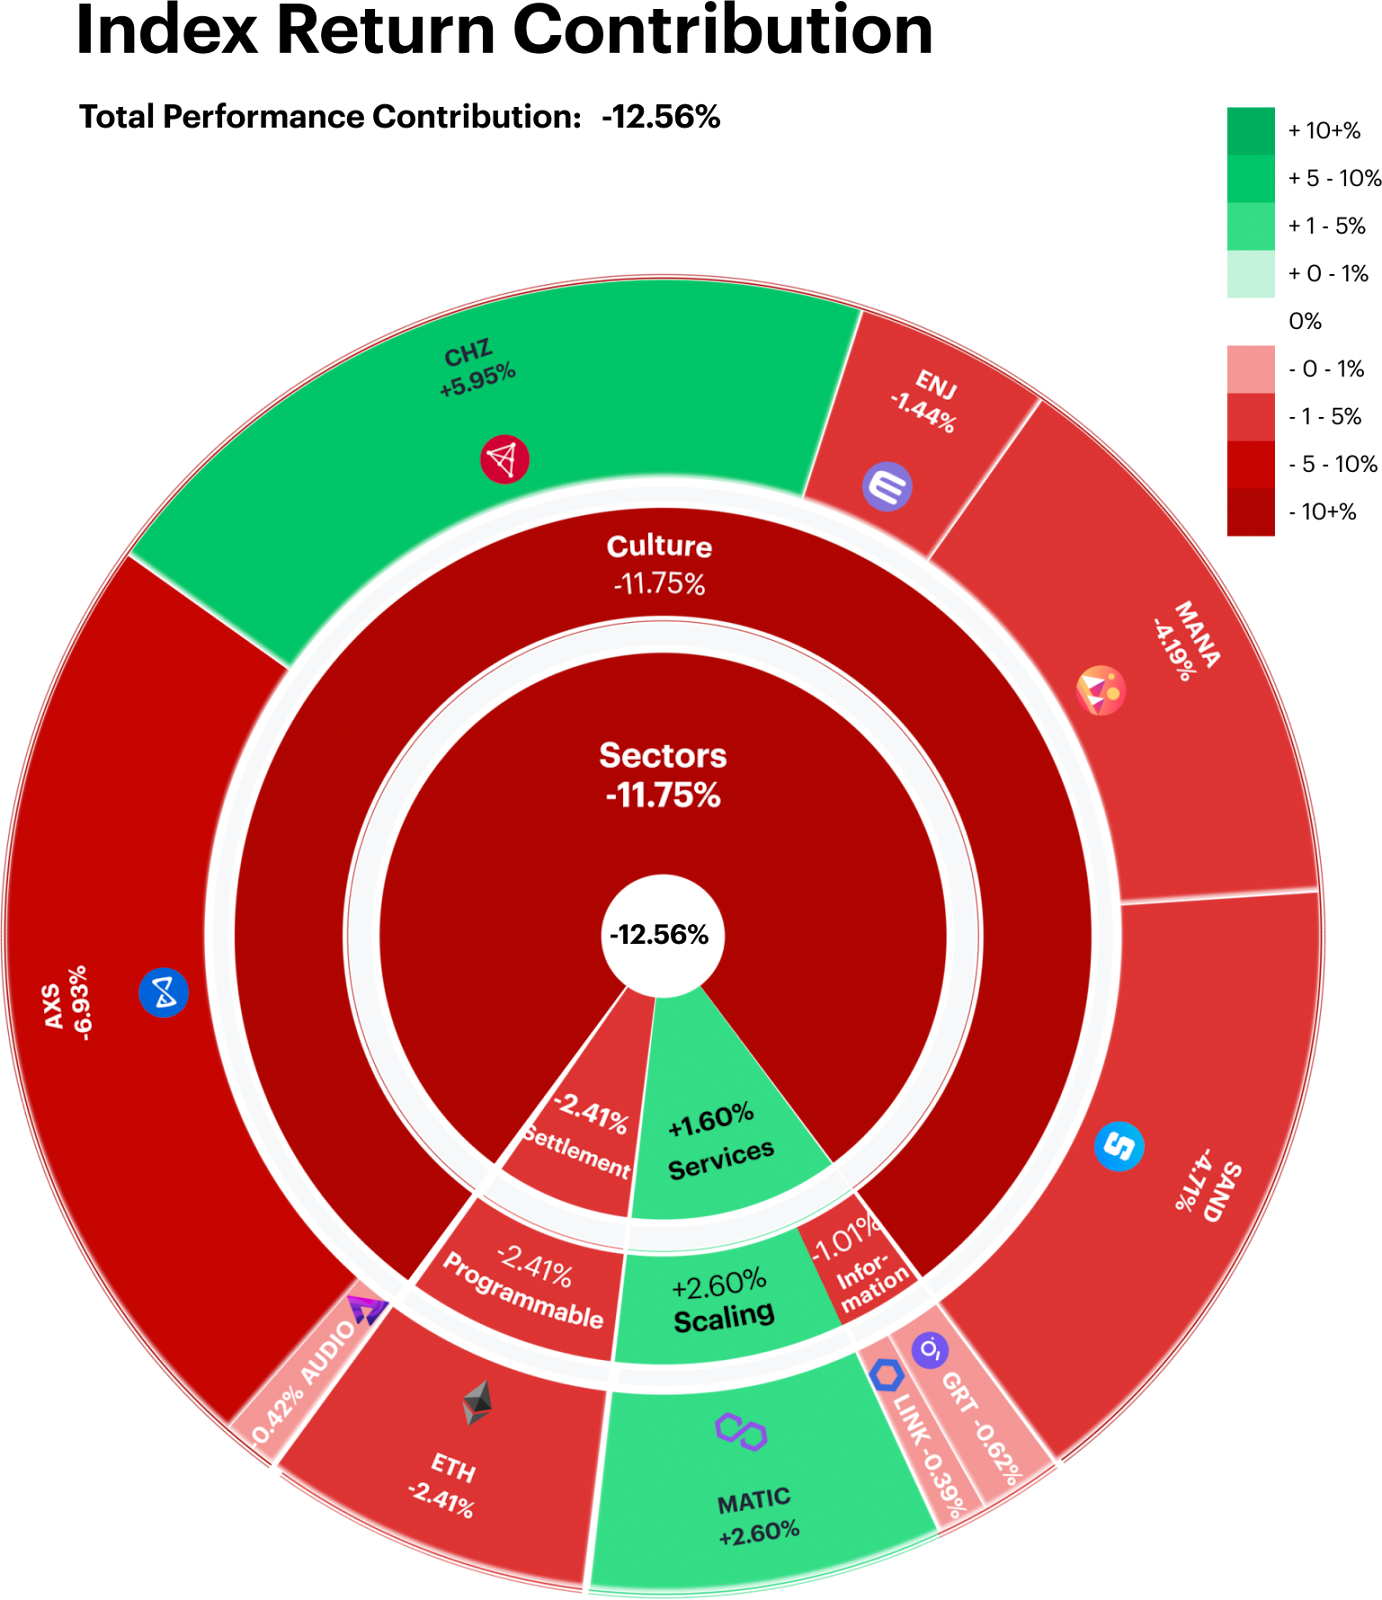
The CF Digital Culture index fell -12.5% as performance contributions from the complementary Services segment was overwhelmingly negated by the -11.8% performance contribution found in the headline segment (Culture).
From a level 2 DACS perspective, the Scaling segment soared, with MATIC contributing +2.6%. Lastly, the Programmable segment displayed relative resilience with its modest -2.4% performance contribution.
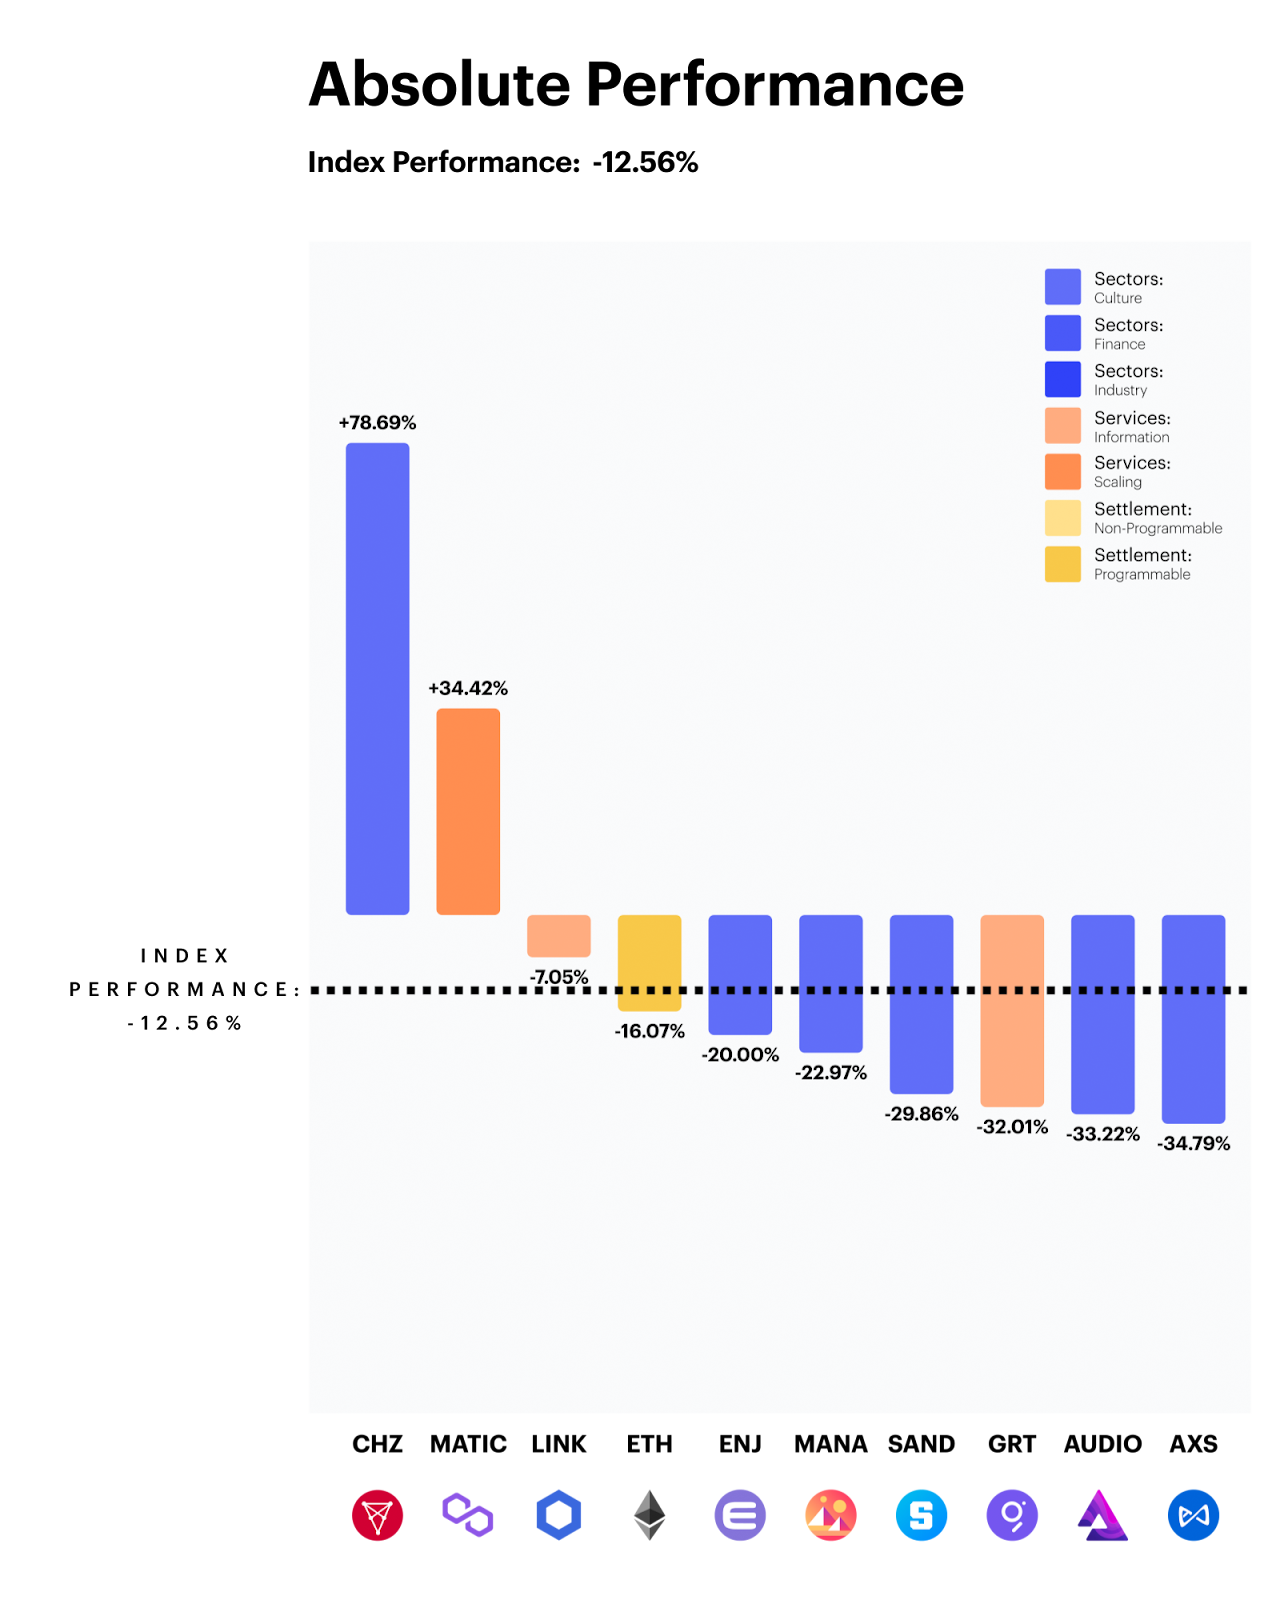
Breadth Broadly Negative
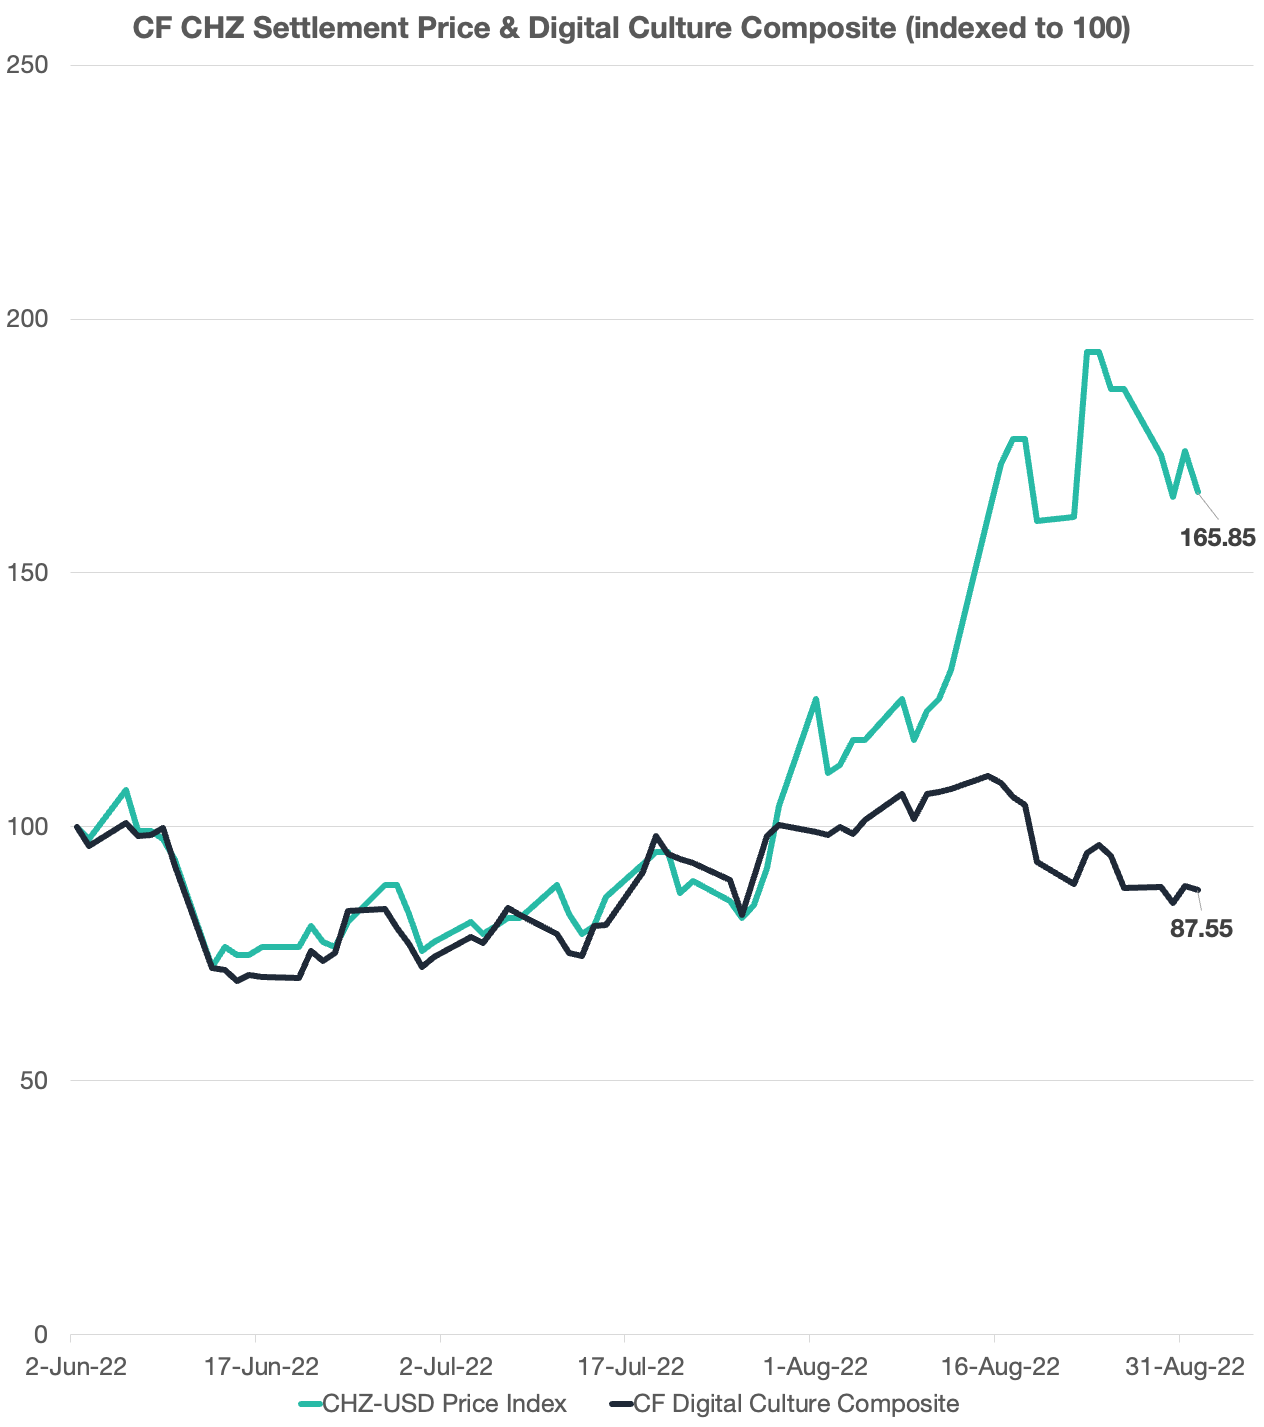
Market breadth in the CF DIgital Culture Composite remained historically low. Of the 6 constituents in the Culture Segment, 5 underperformed the index by a margin of 8% or more (in absolute terms). Additionally, the average performance of this cohort ex-CHZ was approximately -30% for the period. CHZ remained a true standout, posting a 78% rally after Chiliz attained a new strategic partnership with one of Europe's most prestigious football clubs.
Outside of the headline group, the Layer 2 scaling solution (MATIC) rose over +34.4%, leaving it as the only other token to finish in positive territory. Layer 2 solutions have seen a pick up in investor sentiment that can be attributed to the recent timeline announcement for the Ethereum blockchain merge.
NFT Market Activity Update
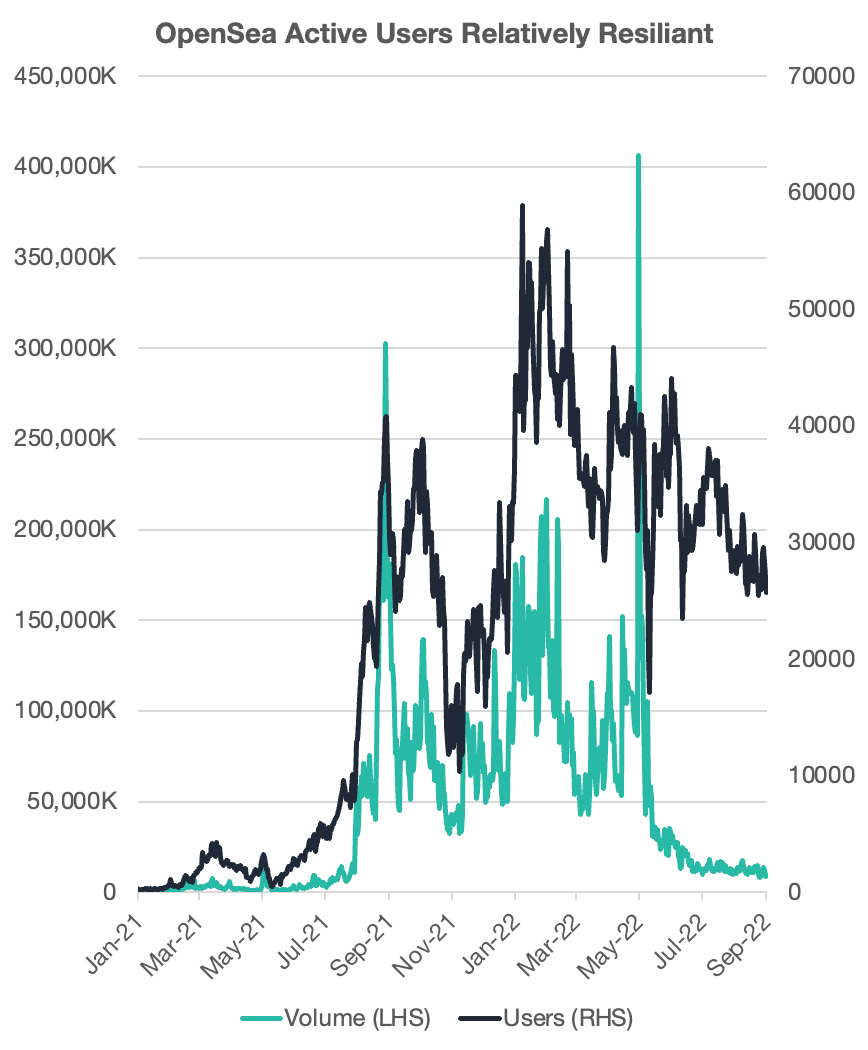
Exuberance in the NFT space seems to have dissipated. The world’s largest NFT marketplace has seen a flatline in transaction volume over the past quarter. Volumes averaged between 75K-125K from the September ‘21-May’22 bull market run. In early June, transaction volumes broke below 30K for the first time since August of 2021.
This turmoil has had a sizable impact on on the top performing NFTs, floor prices for the Bored Ape Yacht Club recently broke below 70 ETH, down approximately 55% from the all time highs.
Meanwhile, users of the OpenSea Platform have also been on a steady down trend. Although, the declines in users have been more resilient in comparative terms, and user counts still remain above, or close to, the bull-run range. The normalization that has taken place in the NFT marketplace has certainly been painful, but the recent normalization in sentiment, along with an increase in institutional adoption, should be supportive for future developments in the space.
Barça Bump for GameFi Token
FC Barcelona, one of the most popular football organizations in the world, announced a strategic €100m investment into Chiliz (CHZ). The Chiliz blockchain network creates customized fan tokens for sports teams. Fans around the world will be able to purchase the team’s tokens using CHZ tokens, and token holders will have exclusive benefits and rewards. The announcement of the partnership sent prices soaring, leaving CHZ to be the top performer in our CF Digital Culture Index.
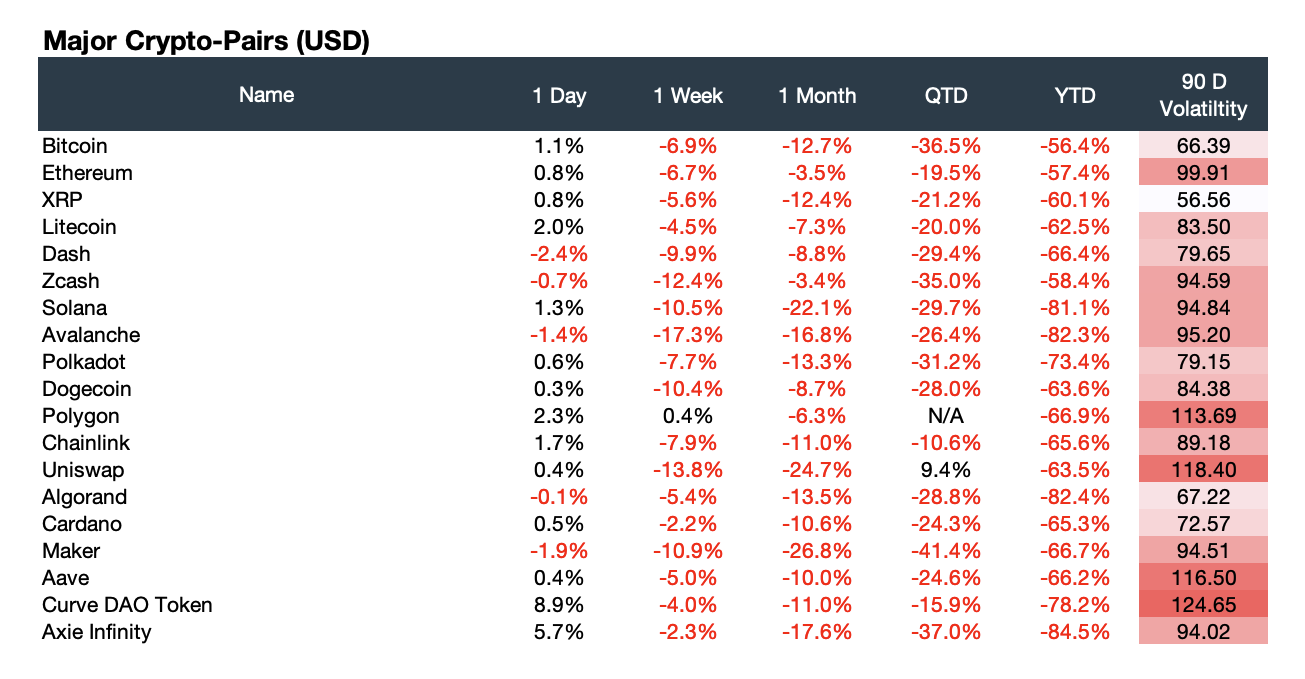
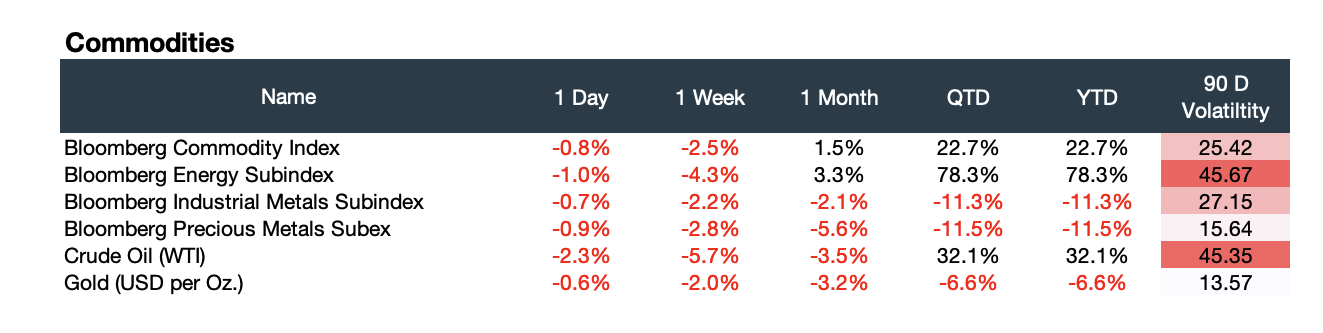
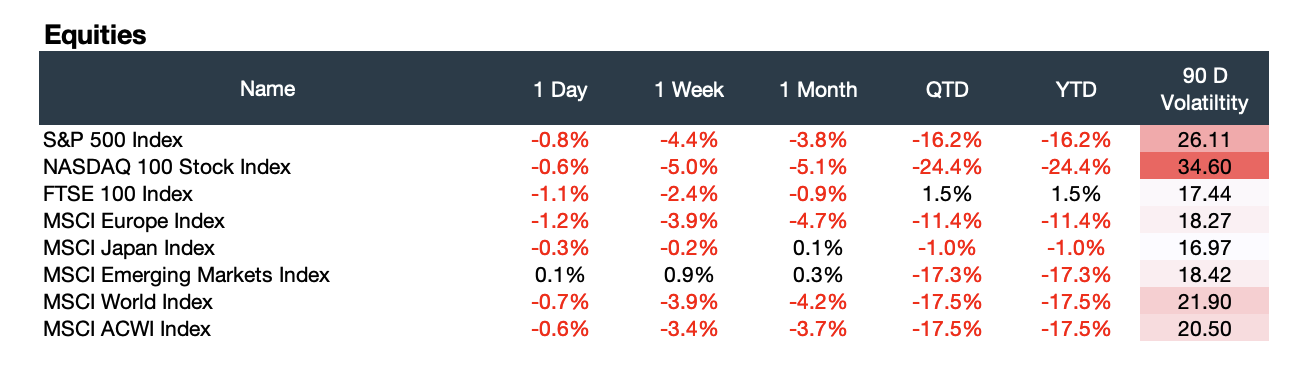
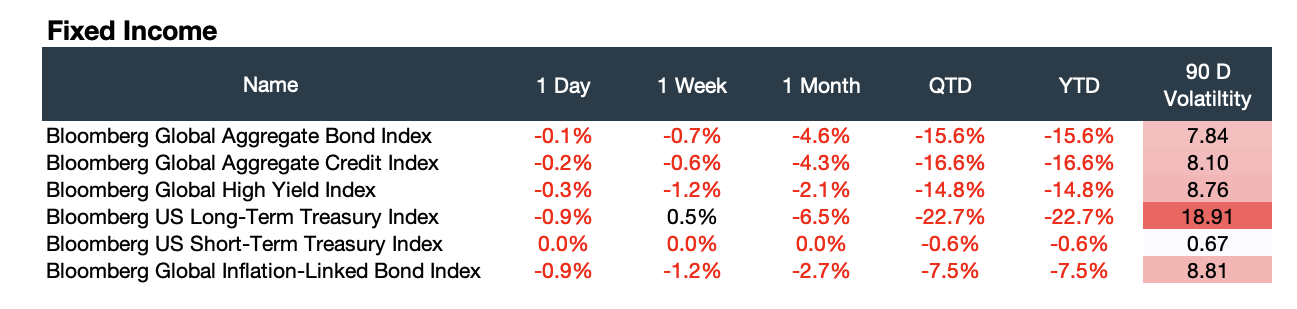
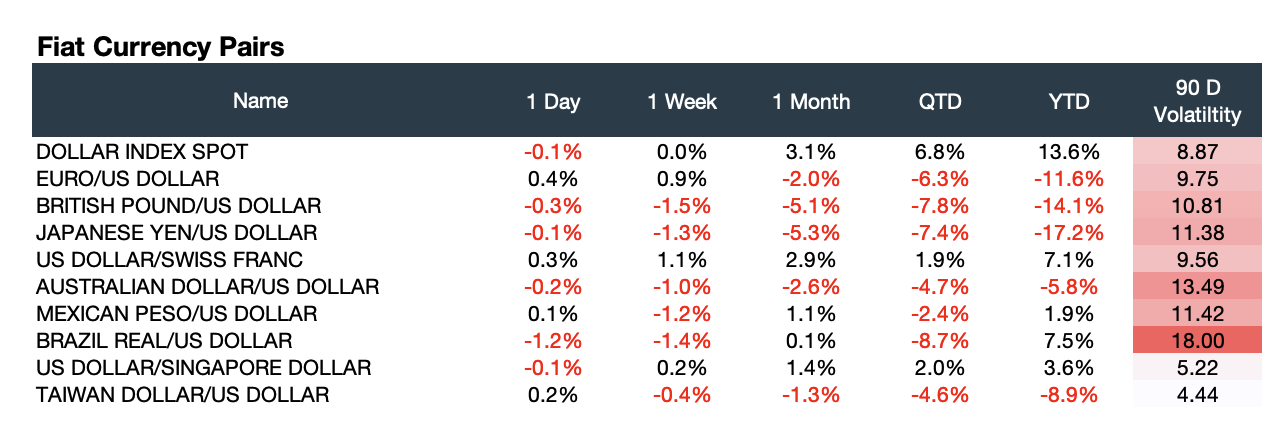
Appendix: Market Performance Overview
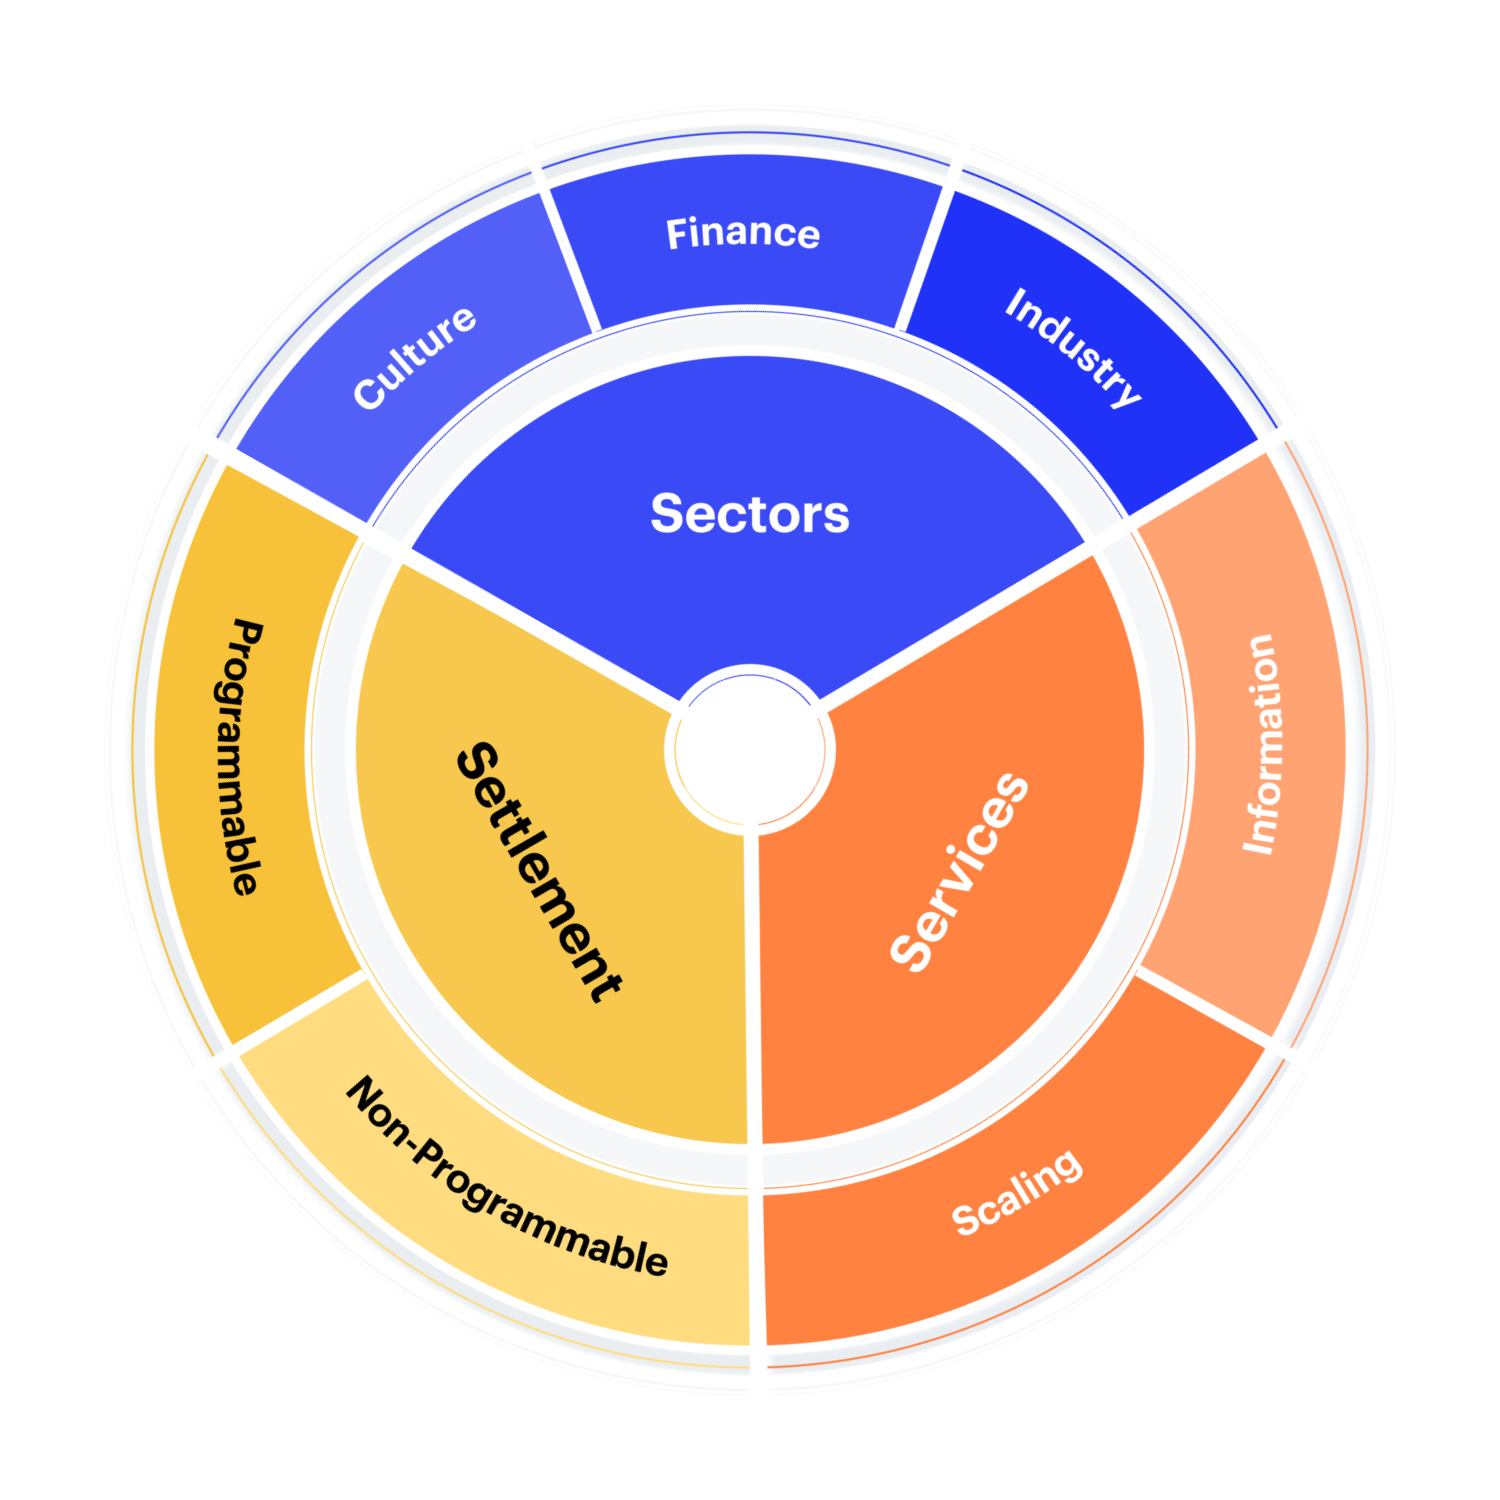
Appendix: CF Digital Asset Classification Structure
The CF Digital Asset Classification Structure (DACS) classifies coins and tokens based on the services that the associated software protocol delivers to end users, grouping assets by the role they play in delivering services to end users. The CF DACS powers CF Benchmarks' sector composite and category portfolio indices and allows users to perform attribution analysis to better understand the fundamental drivers of returns within their digital asset portfolios.
Additional Resources
For more information about our CF Benchmark indices and our methodologies, please visit the respective web links below:
- CF Diversified Large Cap Index
- CF DeFi Composite Index
- CF Web 3.0 Smart Contract Platforms Index
- CF Digital Culture Composite Index
- CF Blockchain Infrastructure Index
- CF Cryptocurrency Ultra Cap 5 Index
Contact Us
Have a question or would like to chat? If so, please drop us a line to:
The information contained within is for educational and informational purposes ONLY. It is not intended nor should it be considered an invitation or inducement to buy or sell any of the underlying instruments cited including but not limited to cryptoassets, financial instruments or any instruments that reference any index provided by CF Benchmarks Ltd. This communication is not intended to persuade or incite you to buy or sell security or securities noted within. Any commentary provided is the opinion of the author and should not be considered a personalised recommendation. Please contact your financial adviser or professional before making an investment decision.
Note: Some of the underlying instruments cited within this material may be restricted to certain customer categories in certain jurisdictions.
Changes to the Token Market Price Benchmarks Series - Market Prices – 21 July 2026
The Administrator has confirmed changes to the Token Market Price Family for the period 14 July 2026 to 21 July 2026.

CF Benchmarks
Softer CPI Reprices July Hike Risk & Lifts Digital Assets
Digital assets extended their recovery over the past week as cooler US inflation prints repriced Fed expectations; the bid was broad across the large cap indices, growth factor leadership returned, stablecoin funding repriced lower, and stress stayed isolated in names hit by token-specific news.
Mark Pilipczuk
Notice of the Demising of CF Dai-Dollar Settlement Price and Spot Rate
The Administrator announces that it will demise the CF Dai-Dollar Settlement Price (DAIUSD_RR) and CF Dai-Dollar Spot Rate (DAIUSD_RTI) which are members of the CF Digital Asset Index Family.
CF Benchmarks
By clicking Accept, you consent to CF Benchmarks's use of cookies.
Visit Cookie Settings to learn how CF Benchmarks uses cookies and to adjust your preferences.