
Apr 14, 2026
Most Factors Retreat in Extended Market Correction
Key takeaways:
Most Factors Declined in Q1
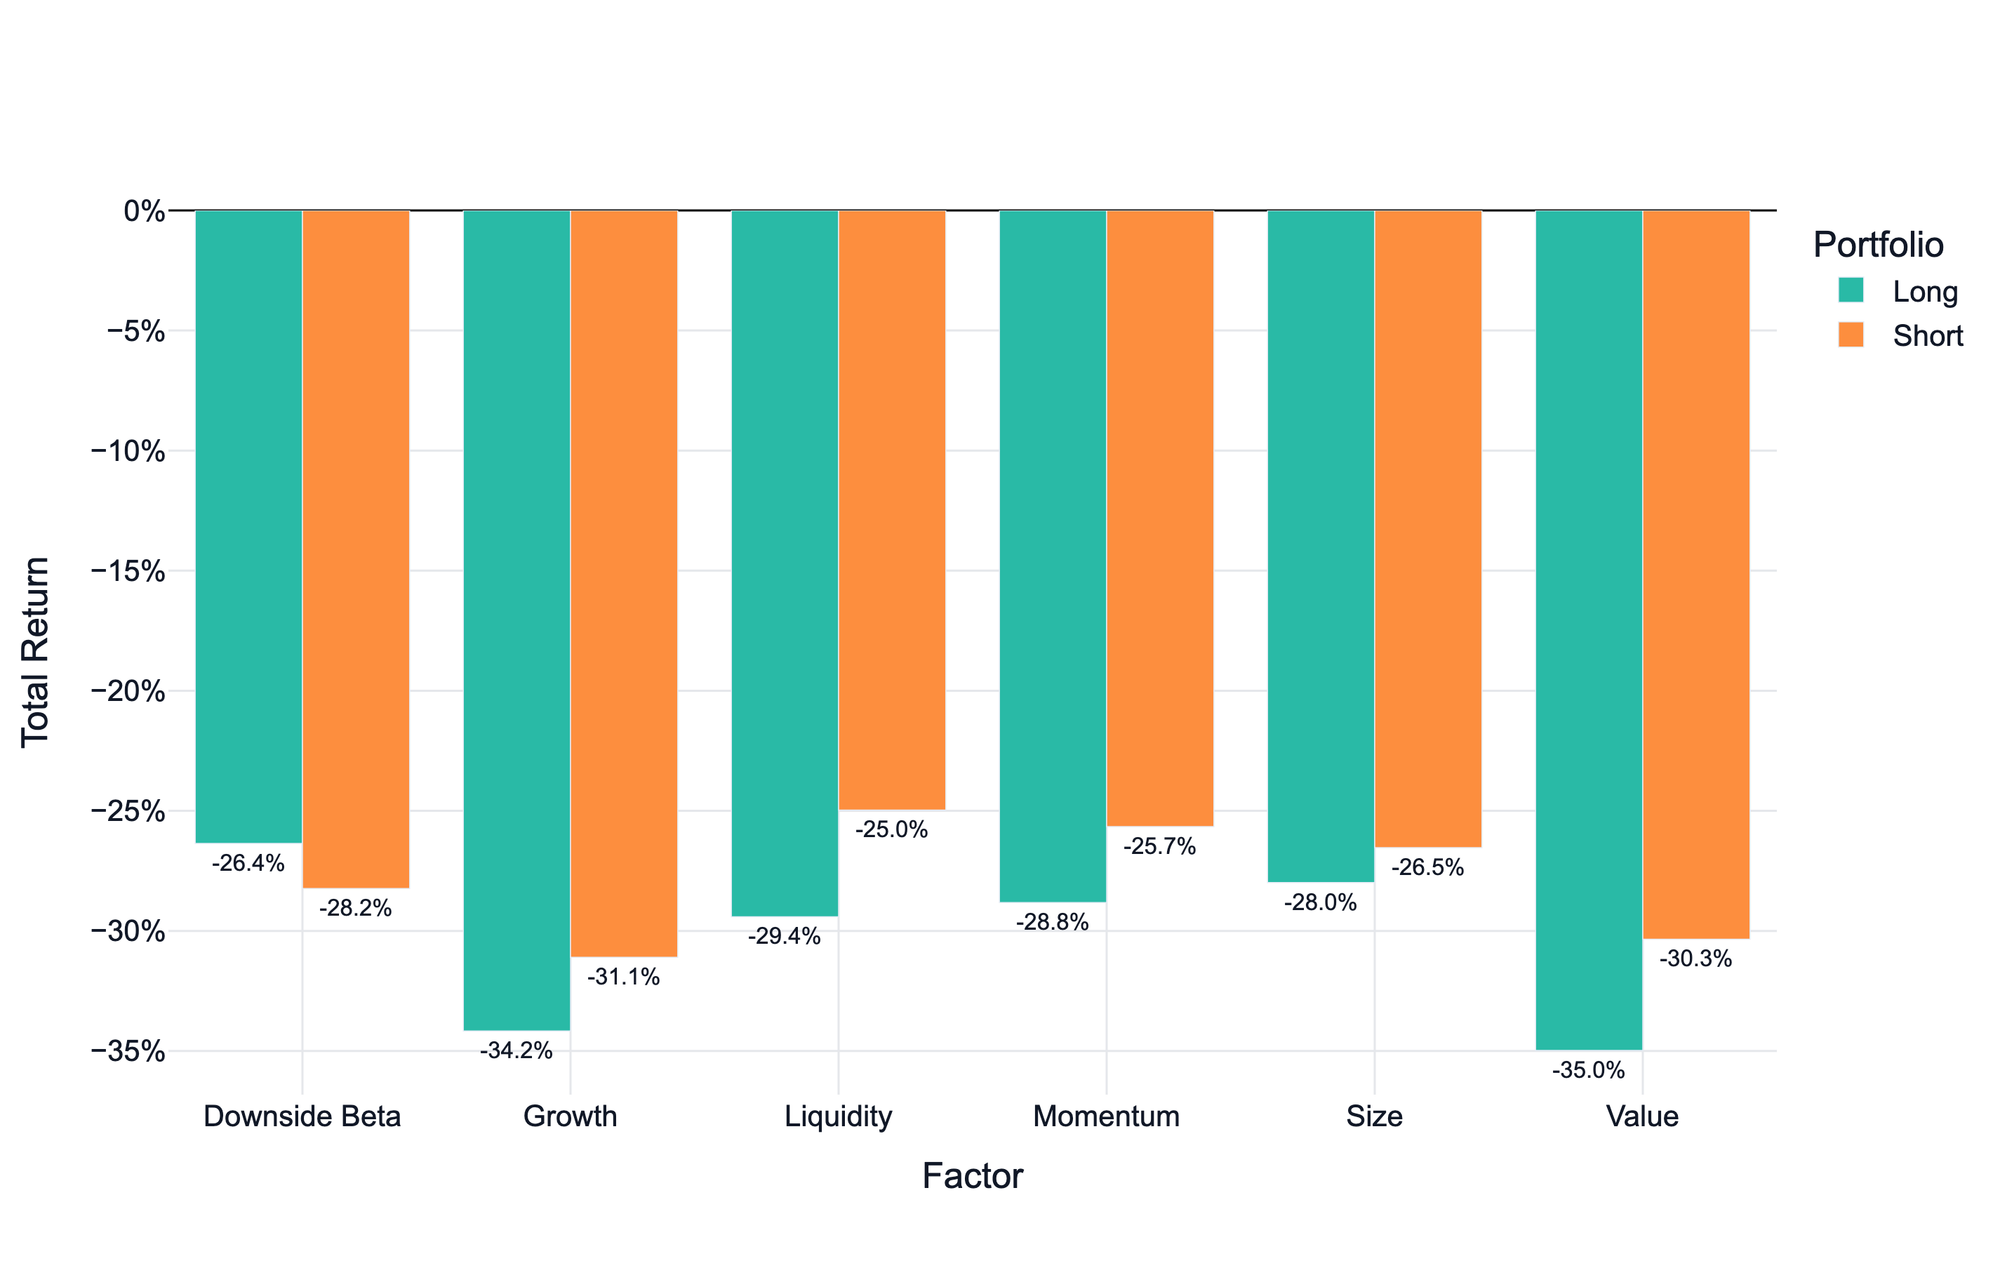
Q1 2026 extended the corrective phase from Q4 2025, with the CF Broad Cap Index declining 24.9% during the quarter. Factor dispersion narrowed meaningfully relative to the prior quarter, as nearly all long/short factor portfolios saw negative returns. Size was the sole factor to post a marginally positive return (+0.1%), suggesting that smaller-cap tokens kept pace with their larger-cap peers. Downside Beta was nearly flat (-0.5%), indicating minimal differentiation between tokens with higher and lower downside sensitivity. Growth (-2.0%), Value (-2.8%), Momentum (-3.1%), and Liquidity (-3.7%) all finished in negative territory, with Liquidity the weakest factor. The compressed factor spread suggests a more indiscriminate selloff, with limited reward for factor-based positioning.

Broad-Based Weakness Limits Factor Differentiation in Q1
In the first quarter of 2026, Downside Beta stood out as the most resilient factor on the long side, followed by Size and Momentum. On the short side, Growth and Value delivered the strongest results, with Downside Beta ranking third. The Q1 factor profile points to an environment of broad-based weakness: nearly all net factor returns clustered slightly below zero, suggesting limited differentiation between long and short portfolio exposures as the market sold off indiscriminately.
The CF Settlement Category Index Reflects Near-Pure Market Exposure
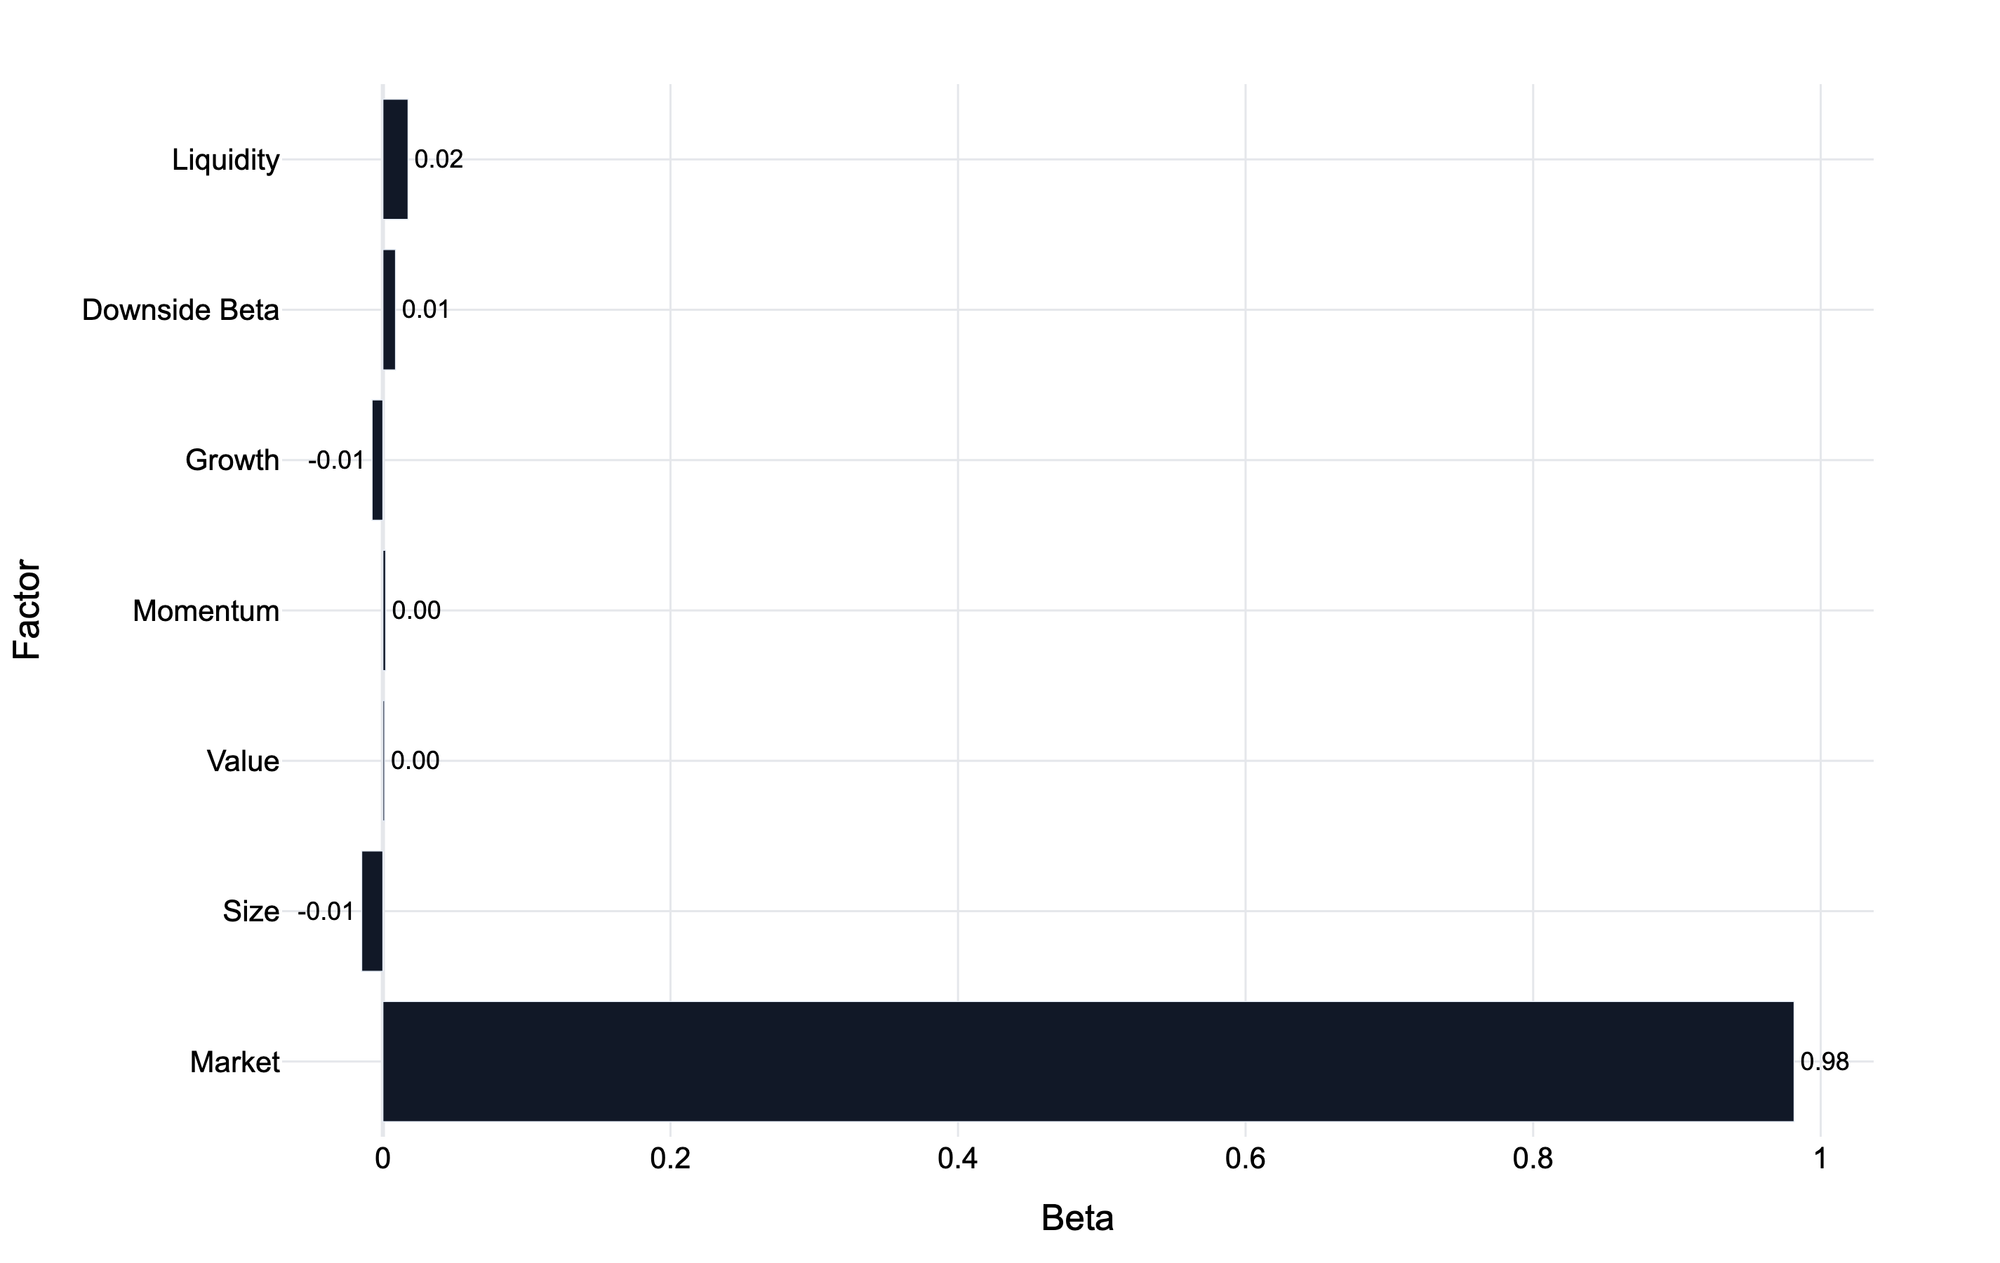
The CF Settlement Category Index's factor beta profile in Q1 2026 reflects nearly pure market exposure. Market beta registered at 0.98, effectively one-to-one with the broad market. All remaining factor tilts are negligible: Liquidity (0.02) and Downside Beta (0.01) are fractionally positive, Value (0.00) and Momentum (0.00) are flat, while Size (-0.01) and Growth (-0.01) are fractionally negative. This near-neutral profile is consistent with prior quarters and reflects the continued dominance of Bitcoin within the index, whose outsized weight effectively absorbs constituent-level factor variation. Overall, the Settlement Category Index behaves as a close proxy for broad market exposure with minimal non-market factor sensitivity.
The CF Services Category Index Combines Growth and Size Tilts with Liquid, Risk-On Positioning
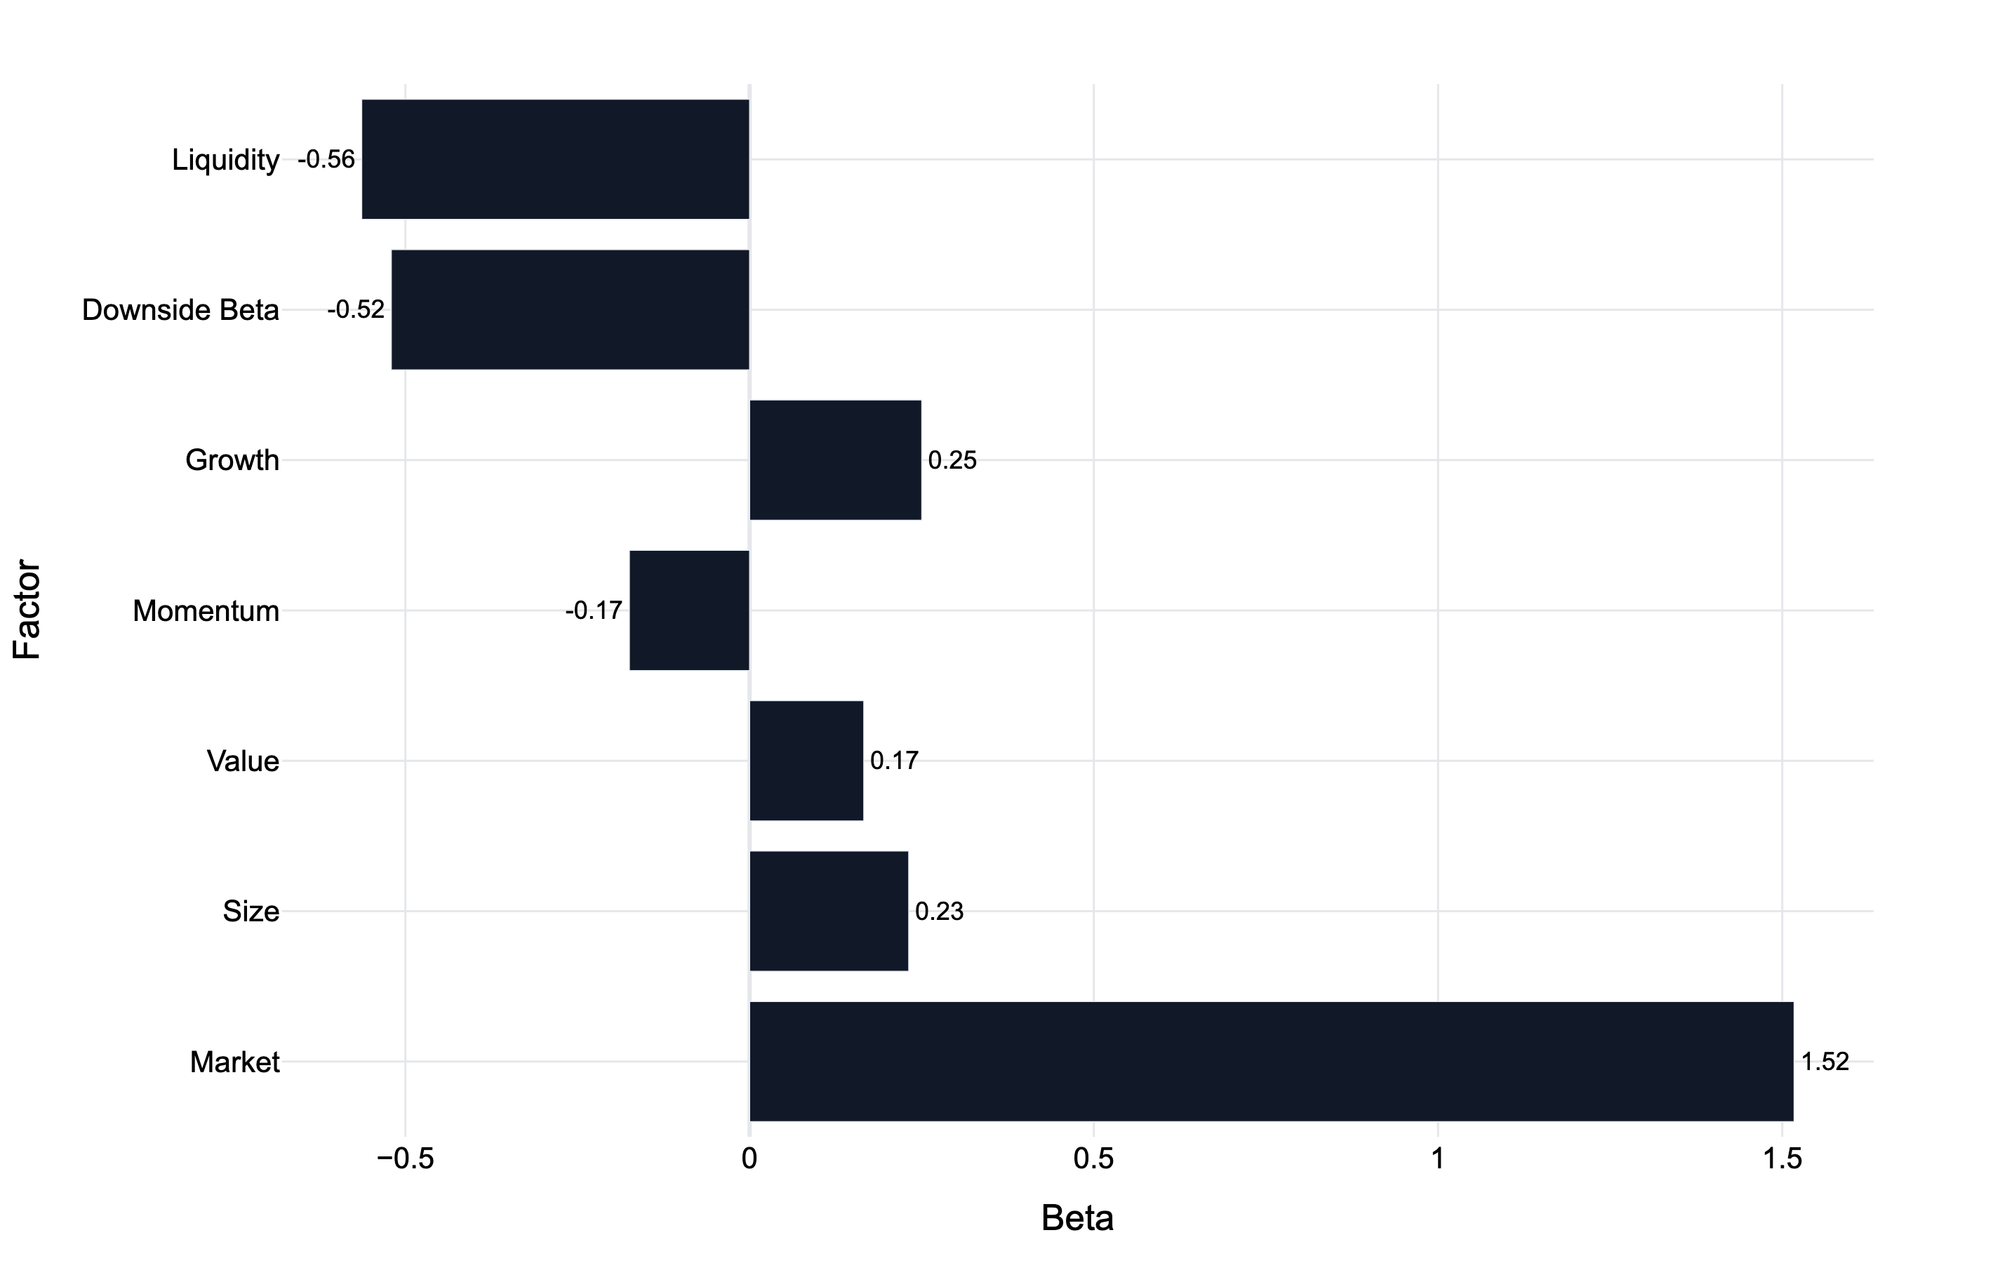
The CF Services Category Index exhibits a differentiated factor beta footprint in Q1 2026. Market beta is elevated at 1.52, indicating above-average sensitivity to broad market movements. Growth (0.25) and Size (0.23) are moderately positive, reflecting a tilt toward smaller-cap tokens with expanding on-chain activity, while Value is modestly positive (0.17). On the negative side, Liquidity (-0.56) and Downside Beta (-0.52) are meaningfully negative, reflecting a bias toward more liquid names with higher downside sensitivity. Momentum is slightly negative (-0.17). Overall, the Services Category Index combines above-market beta with growth and size tilts alongside liquid, risk-on positioning, a profile that can amplify gains in constructive markets but raises vulnerability during periods of risk aversion.
The CF Sectors Category Index Displays the Highest Market Sensitivity Among Category Indices
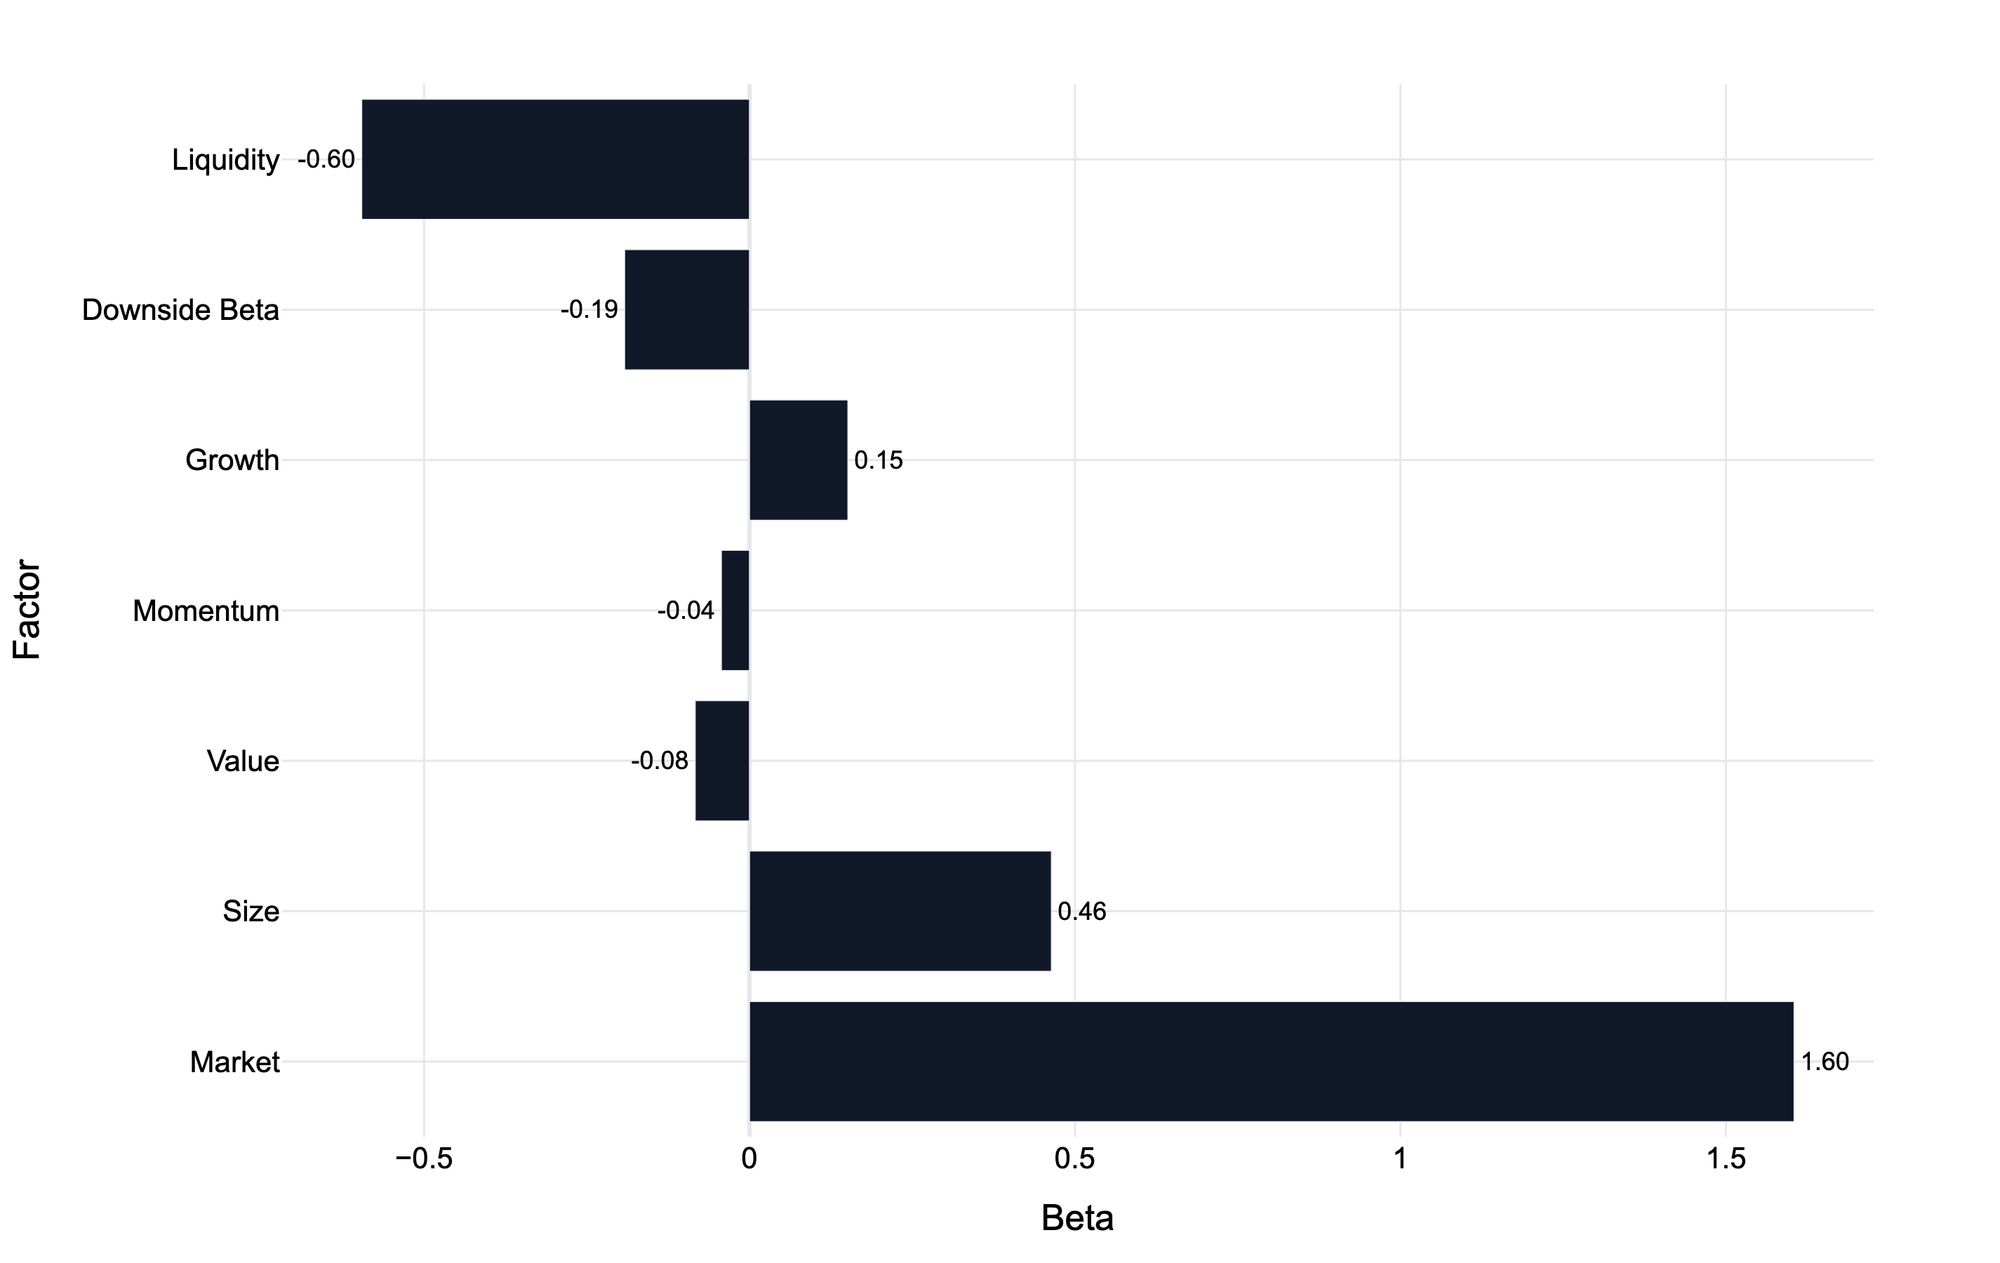
The CF Sectors Category Index displays an amplified market sensitivity in Q1 2026, with Market beta the highest among the three category indices at 1.60. Size is notably positive (0.46), reflecting a pronounced small-cap tilt. Growth is modestly positive (0.15), while Momentum (-0.04) and Value (-0.08) are near neutral. Downside Beta is modestly negative (-0.19), and Liquidity is the most pronounced negative tilt at -0.60, indicating a preference for more liquid tokens. Overall, the Sectors Category Index combines elevated market sensitivity with a small-cap orientation and liquidity bias, a profile that amplifies broad market movements and raises vulnerability during risk-off episodes.
To read the complete report, kindly click on the provided link (or click here to view a PDF version). Additionally, please do not forget to subscribe to our latest news and research for the most relevant institutional insights on digital assets and the top digital assets by market cap.
The information contained within is for educational and informational purposes ONLY. It is not intended nor should it be considered an invitation or inducement to buy or sell any of the underlying instruments cited including but not limited to cryptoassets, financial instruments or any instruments that reference any index provided by CF Benchmarks Ltd. This communication is not intended to persuade or incite you to buy or sell security or securities noted within. Any commentary provided is the opinion of the author and should not be considered a personalised recommendation. Please contact your financial adviser or professional before making an investment decision.
Note: Some of the underlying instruments cited within this material may be restricted to certain customer categories in certain jurisdictions.
Softer CPI Reprices July Hike Risk & Lifts Digital Assets
Digital assets extended their recovery over the past week as cooler US inflation prints repriced Fed expectations; the bid was broad across the large cap indices, growth factor leadership returned, stablecoin funding repriced lower, and stress stayed isolated in names hit by token-specific news.

Mark Pilipczuk
Notice of the Demising of CF Dai-Dollar Settlement Price and Spot Rate
The Administrator announces that it will demise the CF Dai-Dollar Settlement Price (DAIUSD_RR) and CF Dai-Dollar Spot Rate (DAIUSD_RTI) which are members of the CF Digital Asset Index Family.
CF Benchmarks
Addition of the Tether Gold Settlement Price and Spot Rate to the CF Digital Asset Index Family
The Administrator announces the addition of the Tether Gold Settlement Price and Spot Rate to the CF Digital Asset Index Family - Single Asset Series.
CF Benchmarks
By clicking Accept, you consent to CF Benchmarks's use of cookies.
Visit Cookie Settings to learn how CF Benchmarks uses cookies and to adjust your preferences.