
Apr 29, 2026
Is It Too Late to Launch New US Bitcoin ETFs?
Early-flow lessons from the U.S. spot Bitcoin market
Too Big to Trail: The $100bn U.S. Bitcoin ETF Market
Institutional access to Bitcoin has moved quickly since the first U.S. spot Bitcoin ETPs began trading in January 2024. By late April 2026, the U.S. spot Bitcoin ETP market has become large, liquid, and highly concentrated. Public trackers (e.g. this one, provided by Farside Investors) put aggregate assets above $100bn, while BlackRock’s iShares Bitcoin Trust ETF (IBIT) holds around two thirds of these on its own at the time of writing, with net assets of around $63bn.
The Late-Mover’s Dilemma
That leaves late entrants facing a dilemma. The category is now too large for major asset managers to ignore, but it is also mature enough that first-mover advantages may be difficult to overcome. The Morgan Stanley Bitcoin Trust (MSBT) which listed earlier this month, appears to be the clearest current test. Morgan Stanley Investment Management notes that it is the first U.S. bank-affiliated asset manager to offer a cryptocurrency ETP, underlining that there are still plenty of major providers waiting on the sidelines. Among these, Goldman Sachs has also signaled that it too will wait no longer, filing a preliminary prospectus for the Goldman Sachs Bitcoin Premium Income ETF, adding to the sense that large traditional financial institutions are still looking for ways to join the category.
Is it Later Than We Think?
That is why whether it is now too late to launch a U.S. spot Bitcoin ETF is an interesting question.
This article asks whether early ETF flows can help us judge that late-mover problem. If the first 21, 42, and 63 trading days of the January 2024 cohort contained useful information about later asset gathering, then the first few months of a new fund, like MSBT may offer an early, public read on whether a late entrant can still build durable demand.
It should be stressed that MSBT is a test case and not the whole story.
What early flows can and can’t show
This study uses public flow, trading, issuer, and options data. From the outset we should be clear about what these data sets can show us to avoid being misleading The data can help us assess observable demand signals. They cannot identify end-investor type, advisor platform source, model-portfolio inclusion, internal bank-channel allocation, or the causal driver behind each daily flow.
That caveat is important because ETF flows are not a pure measure of long-term conviction. They can reflect seed capital, tactical trading, arbitrage activity, issuer relationships, tax-sensitive holders, fee changes, platform availability, market timing, launch curiosity, and wider market ‘regime’ at the time of a fund’s launch.
So, our test here is deliberately modest. Early flows do not dictate destiny. They can, however, show whether initial demand persisted once launch noise started to clear.
The working windows are 21, 42, and 63 trading days after launch or spot conversion. That gives us approximate one-, two-, and three-month readings while avoiding calendar quirks.
Same Bitcoin, Different ETFs
Another proviso: it’s important to note that while the cohort of brand new spot Bitcoin funds that were simultaneously listed in January 2024 is an important one, it’s not the only one. Bear in mind that not all U.S. Bitcoin ETFs started from the same place, and these differences can have consequences for early flows.
The January 2024 fresh launches are the cleanest cohort for testing early-flow persistence. Other funds need separate treatment because their launch circumstances were different. In the table below, we’ve summarized the key cohorts and how their differences denote specific treatments within our exploration.
Table 1 – Key U.S. Bitcoin ETF Cohorts
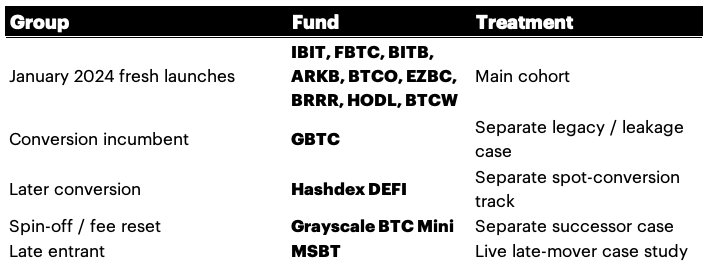
The main comparison should focus on the nine fresh January 2024 launches. Meanwhile, GBTC, BTC Mini, DEFI, and MSBT remain in view, but each needs its own product-history lens.
Signs of Hierarchy
All that said, a cursory look at the first three months of flows for the main group already suggests the emergence of observable tiers
The January 2024 fresh-launch cohort produced a clear hierarchy by the 63rd trading day, as illustrated by the table and graphics below.
Table 2 – January ’24 Cohort 3-Month Flow Performance
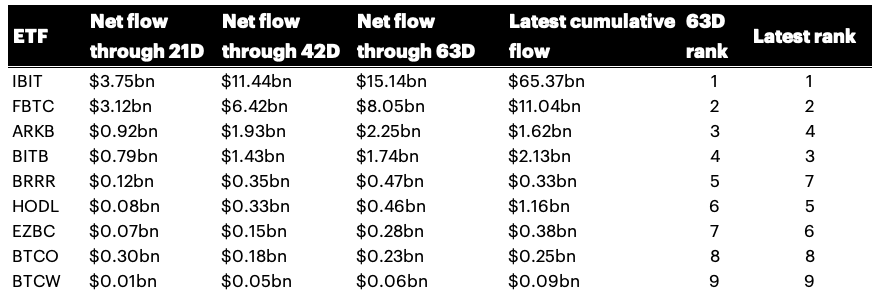
Figure 1 – U.S. Spot BTC ETF January ’24 Cohort – Cumulative Flows, First 63 Days
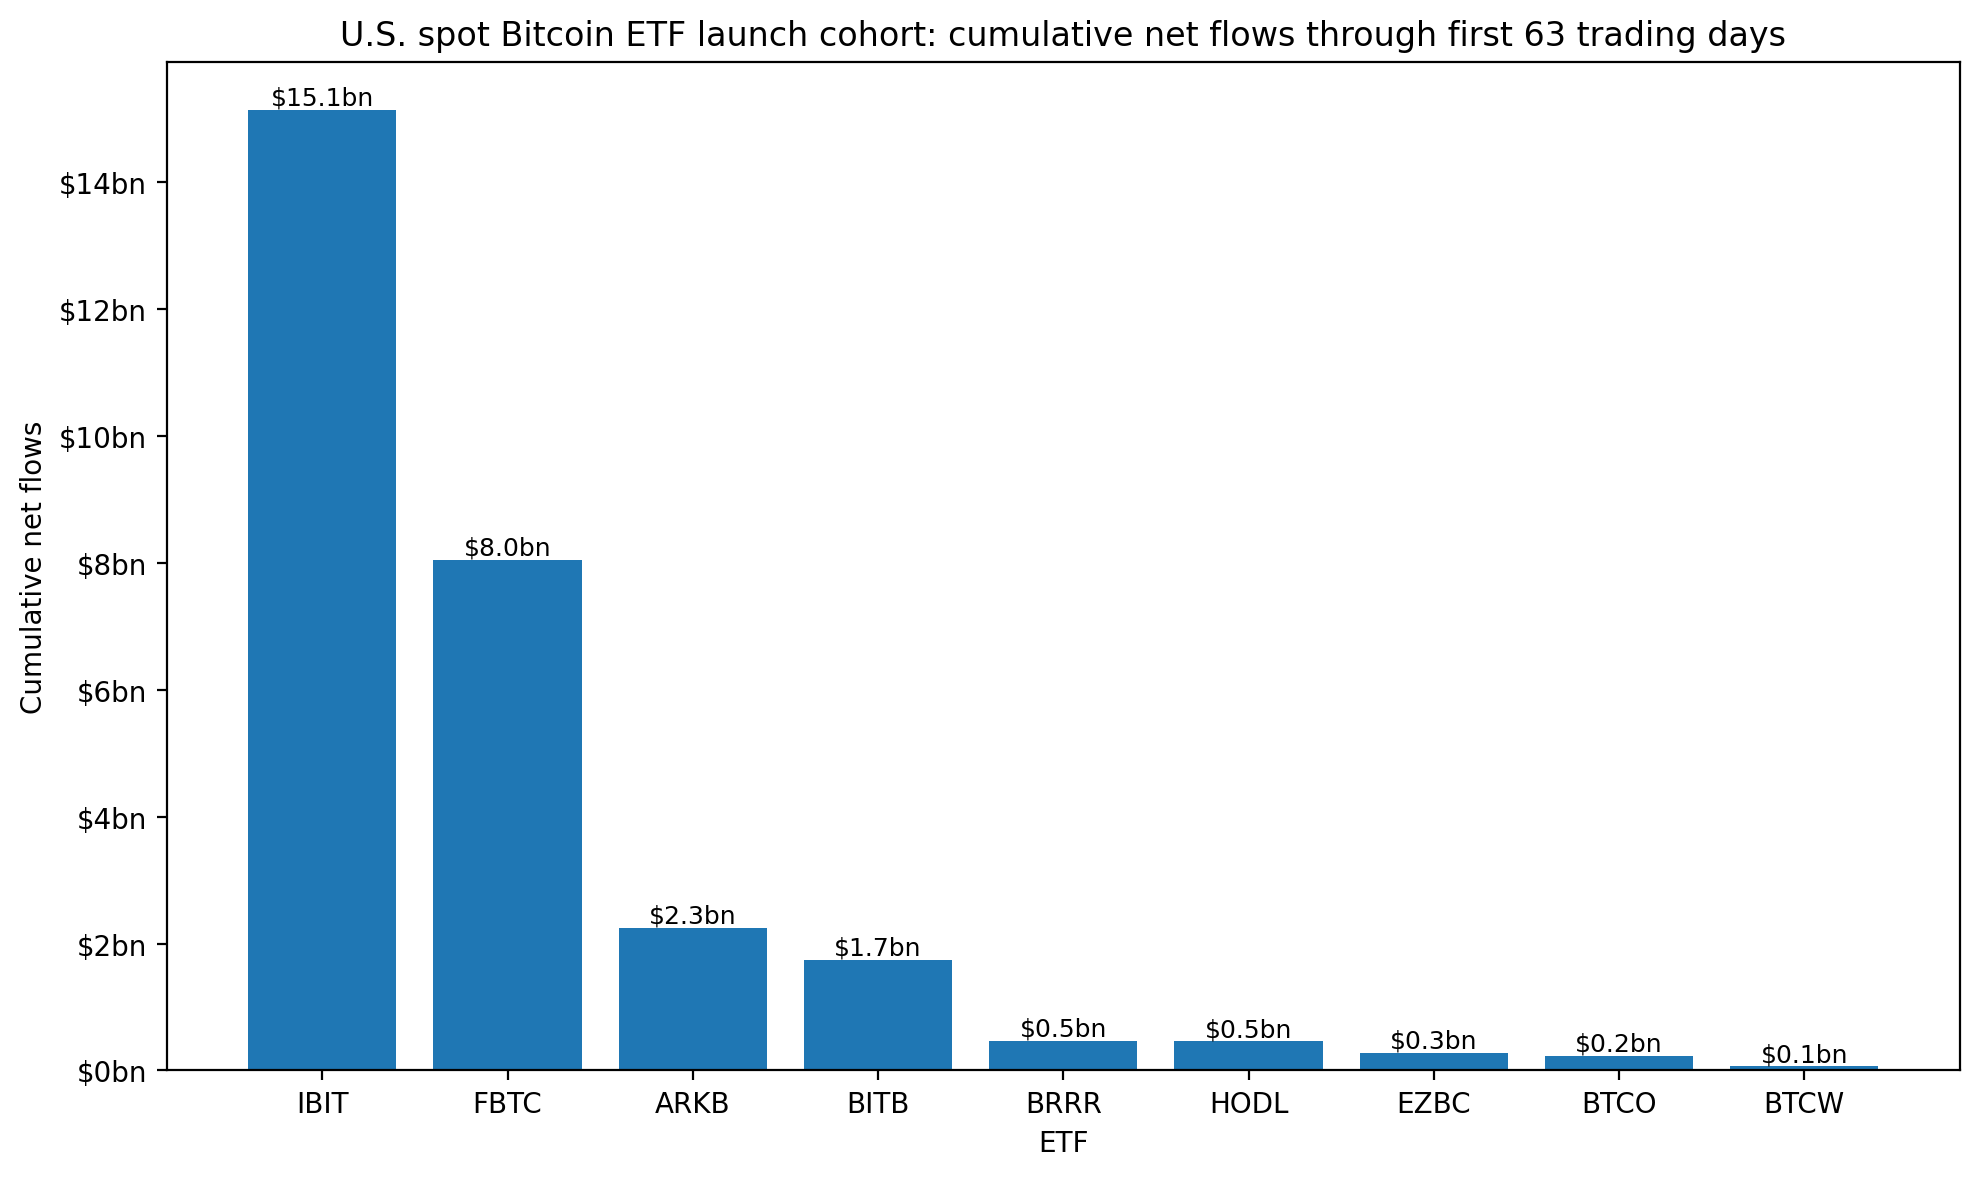
Note that IBIT was already in the lead by the 21-day mark and had pulled even further away by day 63. FBTC was clearly established as the second-largest asset gatherer. ARKB and BITB formed the next tier. The remaining funds were much smaller.
There was some movement after the first three months. BITB later moved ahead of ARKB on cumulative flows. HODL later improved relative to its 63-day rank. BRRR slipped. But the broad shape was visible by the end of the third trading month.
A Genuine Cohort
In this small nine-fund cohort, the rank relationship between 63-day flows and latest cumulative flows is high. The Spearman rank correlation coefficient (Spearman’s Rho) in our working file is about 0.93. To be clear, the sample is too small to get anywhere near a ‘general law’ of ETF launches. And as alluded to earlier, the Bitcoin price environment was unusually supportive in early 2024. Still, for this leading category, the first three months seems to contain useable signal.
A stricter version of the test is less neat. If we compare first-63-day rank with flows gathered after day 63, the rank relationship weakens. IBIT and FBTC still stand out, but the middle of the cohort moves around. That points to a more modest conclusion: early flows were useful for identifying tiers, especially the top tier, rather than for producing a precise long-term ranking model.
Figure 2 – U.S. Spot Bitcoin ETF January ’24 Cohort – Ranked by 63-Day Flow
Day One Wins are ‘Nice to Haves’
Among points that can be stated clearly so far: day-one flows are a less useful predictor. For our key cohort, they captured launch positioning and early operational activity. But by day 42 and day 63, the data showed something more important: whether initial interest had persisted.
That’s an important observation for newly listed funds. A good debut is interesting. A strong 42- and 63-day run would be more persuasive.
IBIT Took Early Lead, Still Holds it
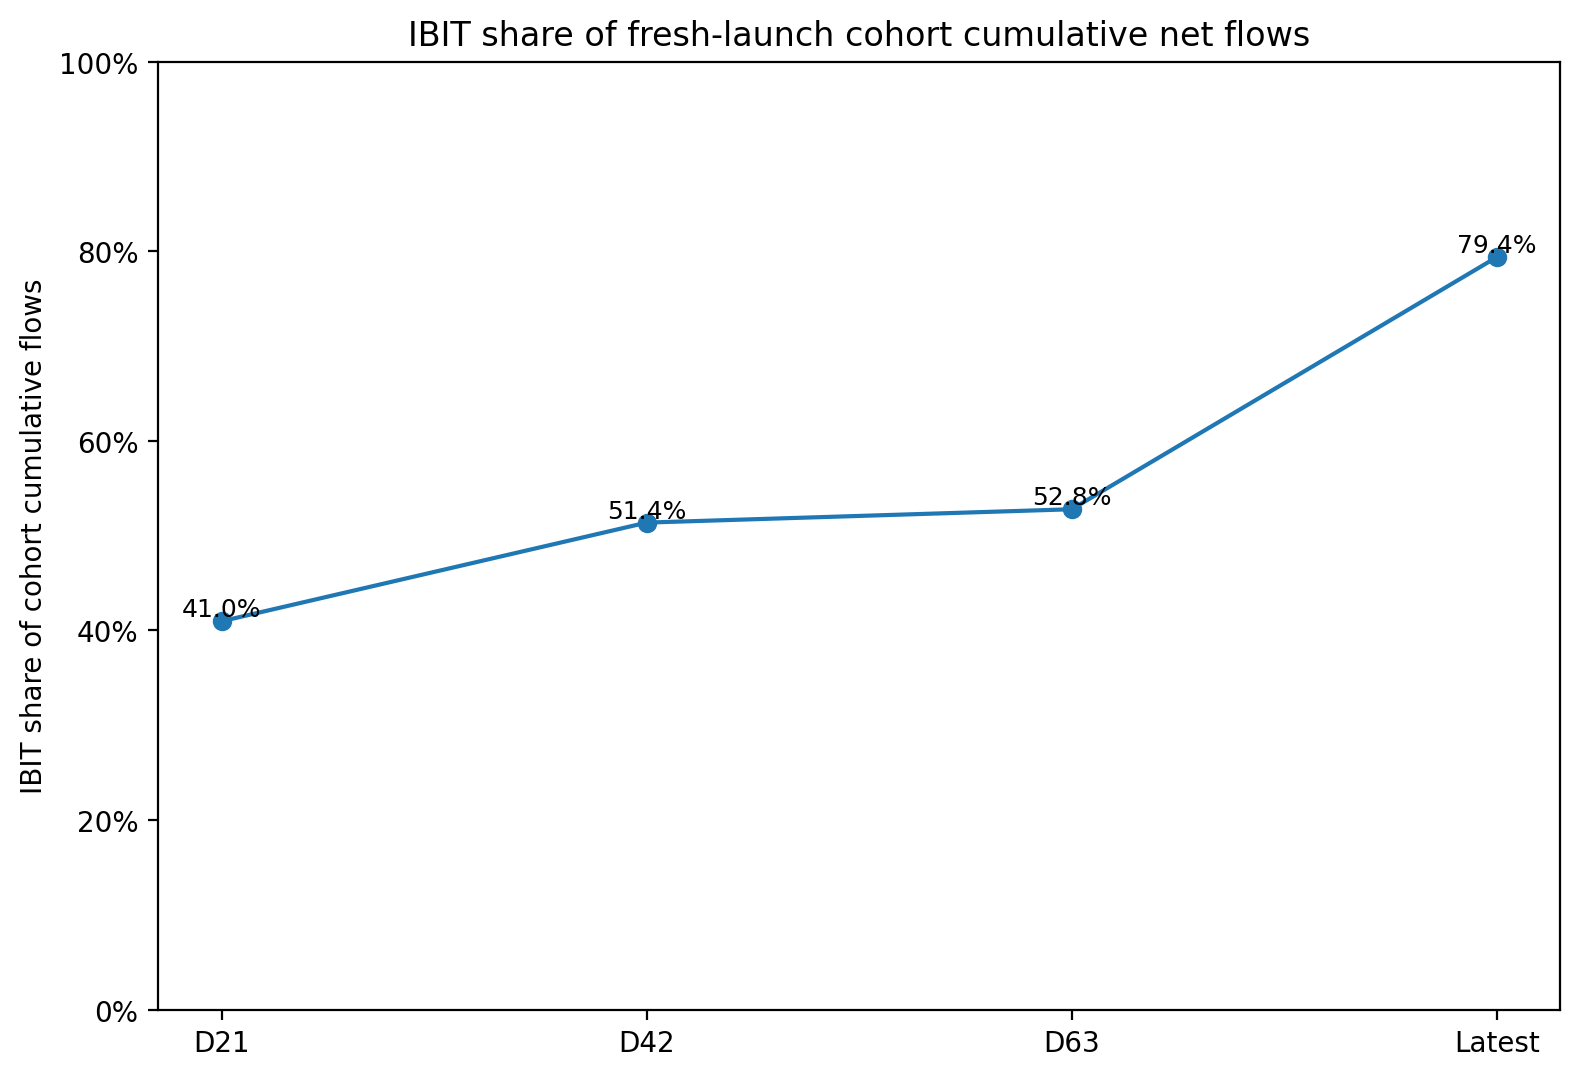
Among IBIT’s numerous remarkable prints to the tape we can note that it had gathered about $15.1bn of net inflows by its 63rd trading session. That equates to roughly 52.8% of cumulative net flows within the fresh-launch cohort. The latest cumulative data collated in our workbook (see Figure 3) show IBIT’s share of cohort flows had risen to about 79.4%.
Figure 3 – Growth of IBIT’S share of Cohort Cumulative Flows
Understanding IBIT’s edge
So, IBIT’s first-three-month lead did not merely persist. It became larger.
Part of that result is undoubtedly down to brand and distribution. Part could be related to fee competitiveness – though IBIT was not the lowest-fee product. BlackRock’s position in the ETF market also counts. As well, once IBIT became the liquidity centre, its size probably became self-reinforcing.
Large funds tend to trade more – essentially, in relatively elevated volumes. Elevated trading activity affords the best possible conditions for liquidity; and liquidity supports a tendency toward tighter spreads. Tighter spreads can attract more trading and larger allocations. The process is not automatic, but in ETF markets, liquidity often compounds.
Liquidity Reinforces Winners
Two ETFs can both hold spot Bitcoin and still offer different trading experiences.
For large allocators and traders, the total cost of using an ETF is not only its sponsor fee. Spread, premium/discount behavior, market depth, turnover, and trade execution all matter. A cheaper fund can be less attractive if it is harder to trade in size.
The public issuer data we’ve gathered support this reading, at least directionally. In the working liquidity snapshot, iShares’ IBIT page showed roughly $63.0bn of net assets, a 30-day average volume above 44m shares, and a 30-day median bid/ask spread of 0.02%. Bitwise’s BITB page showed a 30-day median spread of 0.03%. WisdomTree’s BTCW page showed a wider 30-day median spread of 0.11% on far smaller assets.
These dates and fields are not perfectly consistent across issuers, so the framing should be read as a public-data snapshot rather than a complete market-data feed. But the direction is clear enough: IBIT has become the category’s trading centre, while FBTC and a few others occupy the next tier.
For late entrants, this is the first problem. It is not enough to launch a cheaper Bitcoin ETF. A new product also has to become useful.
How Options Make IBIT More Useful
Aligned with its dominant size by assets, IBIT also has the largest associated options chain, in terms of open interest.
Table 3 - U.S. Spot Bitcoin ETF January ’24 Cohort – Ranked by Options OI
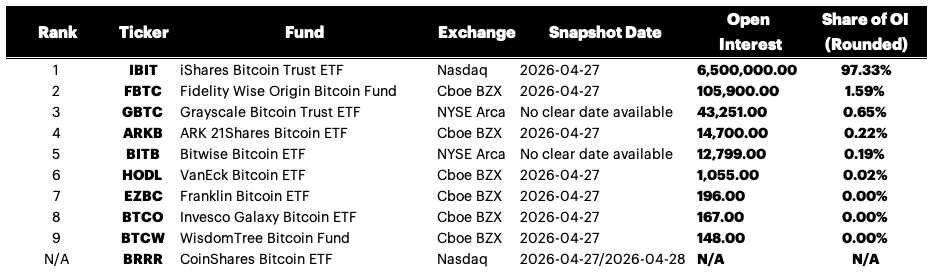
As shown by Table 3, relative to the January 2024 spot Bitcoin ETF cohort, IBIT’s listed options market could justifiably be categorized in a liquidity tier of its own, with 6.5M contracts of aggregate OI, about 61x FBTC and about 150x GBTC.
Still, options do not explain the strength of IBIT’s first three months of flows, since these came later. (The SEC approved options on IBIT in September 2024. Option filings for most of the remaining cohort were approved around a month later.)
So, while IBIT was already the flow leader before options became part of the product story, options may help explain why the lead has now become harder to challenge.
Options Edge
Just like for any underlying share, liquid IBIT options can be used for hedging, can pave the way for covered-call strategies, effective tactical exposure, structured payoffs, and volatility views. These facilities make the ETF more useful than a plain buy-and-hold vehicle. A fund without comparable options activity may still be fine for long-only investors, but it will offer less trading utility.
On that basis, IBIT is the clear options-utility leader judging just by our data set. For color, we can report the file shows heavy first-day options trading in November 2024, with than 500,000 IBIT contracts traded on a single day earlier this month. Other Bitcoin ETFs with options availability haven’t exhibited comparable evidence of depth in this pass.
MSBT and the Late-Mover Test
A simple lesson for issuers is implied here. A 10-basis point fee advantage (for example) might matter for buy-and-hold investors. But for investors who need trading utility, options access, and secondary-market depth, the headline fee is only one variable.
And this is where new entrants face a harder test. Morgan Stanley’s spot Bitcoin fund has had a good start: $30.6m of net inflows on its first trading day April 8th, 2026, and $183.6m of cumulative net inflows through April 24, 2026, with consecutive inflows across all 13 trading days. MSBT’s share of total spot Bitcoin ETF net flows during those 13 trading days was about 7.8%.
Figure 4 – MSBT Early-Flow Tracker
That is a respectable opening for a late entrant. It is not enough to judge the product.
A Better Test
As we’ve suggested though, the better comparison for recently launched Bitcoin ETFs MSBT’s first 21, 42, and 63 trading days against the same windows for the January 2024 fresh-launch cohort.
The key aspects to observe that help determine the outlook for a new Bitcoin fund’s asset gathering potential are the ones we’ve outlined in this piece. They’re summarized, below together along with why the matter.
- First 21-, 42-, and 63-day net flows: can show whether launch demand persists
- Positive-flow day share: tests whether demand is steady or episodic
- Category flow share: measures competitive traction in the current market
- Turnover: shows whether secondary-market use is developing
- Options-availability: shows whether institutional trading utility is emerging
MSBT: Edge and Challenge
MSBT has several things working in its favor: Morgan Stanley’s brand, a low sponsor fee, and the fact that Bitcoin ETF adoption is now familiar to investors who were still evaluating the category in early 2024.
But our cursory look here suggests MSBT also faces three obvious obstacles that any new U.S. Bitcoin ETP must now reckon with: IBIT’s scale, IBIT’s liquidity, and IBIT’s options utility.
Sustained MSBT inflows through 42 and 63 trading days, would suggest the crypto ETP market can support distribution by late-comers. If flows noticeably fade over these windows, the stronger lesson may be that late entrants need more than a lower fee to break an established Bitcoin ETF hierarchy.
Conclusion: What Late Movers Must Show
Either way, the public data point to an immediate takeaway for future entrants: fee competition alone is unlikely to be enough unless the fee gap is large.
The Grayscale case shows that large fee gaps can matter. GBTC’s conversion created a visible leakage story as investors gained access to lower-fee alternatives. But that was a special case: a legacy trust, embedded holders, tax issues, and a much higher fee than the new funds.
MSBT is a different test. Its fee is low, but its fee advantage versus the cheapest established vehicles is measured in basis points, not percentage points. In that range, other variables can matter more; distribution, trading depth, spreads, platform access, and options utility.
There is still room for late movers. The market is not closed. But the bar is higher than it was in January 2024.
The better question is why an investor should use this Bitcoin ETF instead of the one that already has the deepest flows, trading activity, and options market.
MSBT is the latest test of that question.
Note on sources
This draft is based on public data gathered from Farside Investors, issuer websites, SEC filings and approval orders, public quote pages, and public options-data sources. Farside flow data are used as the primary daily-flow source. Issuer pages are used for product terms and selected liquidity fields. Public options data are treated as indicative, not as a complete OPRA-grade
The information contained within is for educational and informational purposes ONLY. It is not intended nor should it be considered an invitation or inducement to buy or sell any of the underlying instruments cited including but not limited to cryptoassets, financial instruments or any instruments that reference any index provided by CF Benchmarks Ltd. This communication is not intended to persuade or incite you to buy or sell security or securities noted within. Any commentary provided is the opinion of the author and should not be considered a personalised recommendation. Please contact your financial adviser or professional before making an investment decision.
Note: Some of the underlying instruments cited within this material may be restricted to certain customer categories in certain jurisdictions.
Changes to the Token Market Price Benchmarks Series - Market Prices – 21 July 2026
The Administrator has confirmed changes to the Token Market Price Family for the period 14 July 2026 to 21 July 2026.

CF Benchmarks
Softer CPI Reprices July Hike Risk & Lifts Digital Assets
Digital assets extended their recovery over the past week as cooler US inflation prints repriced Fed expectations; the bid was broad across the large cap indices, growth factor leadership returned, stablecoin funding repriced lower, and stress stayed isolated in names hit by token-specific news.
Mark Pilipczuk
Notice of the Demising of CF Dai-Dollar Settlement Price and Spot Rate
The Administrator announces that it will demise the CF Dai-Dollar Settlement Price (DAIUSD_RR) and CF Dai-Dollar Spot Rate (DAIUSD_RTI) which are members of the CF Digital Asset Index Family.
CF Benchmarks
By clicking Accept, you consent to CF Benchmarks's use of cookies.
Visit Cookie Settings to learn how CF Benchmarks uses cookies and to adjust your preferences.