
Feb 26, 2026
From Crypto Winter to Crypto Spring: 4 Things to Watch
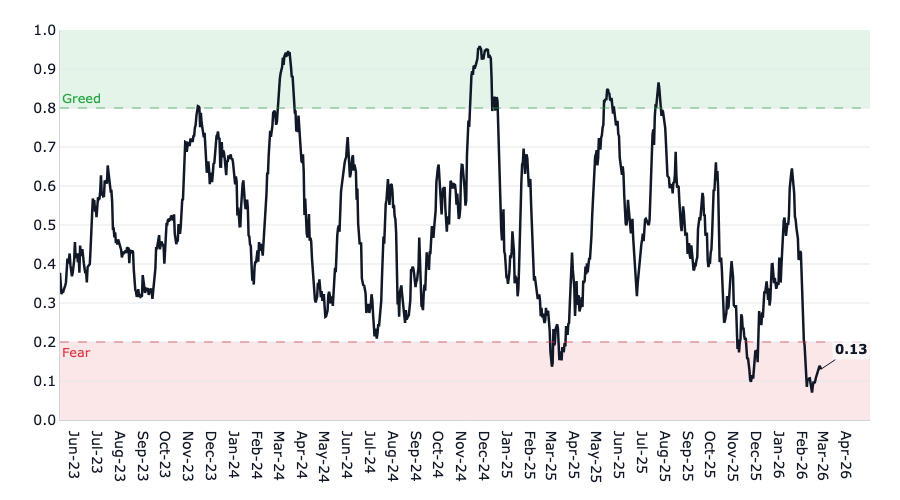
Bitcoin has been cut nearly in half, and for most of the market, it feels even worse. Altcoins are down 70–90%. The CF Broad Cap Crypto Fear & Greed Index hit an all-time low of 0.13. By almost every measure, crypto sentiment has never been this bad.
But beneath the frozen surface, the ground may be thawing. ETF infrastructure held up flawlessly through the downturn. Stablecoin adoption accelerated. Institutional commitments continued to deepen. And the very forces that crushed prices, from geopolitics to monetary policy and regulatory uncertainty, could reverse course faster than the market expects.
CF Broad Cap Crypto Fear & Greed Index
History's best crypto buying opportunities have emerged not when the outlook was brightest, but when conviction was at its lowest and fundamentals were quietly strengthening. In this piece, we examine how we got here and identify four catalysts that could turn the season.
How Did We Get Here?
The current downturn traces back to October 10, 2025. A surprise tariff announcement collided with record open interest and extreme long-side crowding, much of it at 50-100x leverage. When a market is geared with that kind of leverage, it essentially becomes a powder keg waiting to detonate (and it did). According to data from Amberdata and CoinGlass, more than $19 billion in leveraged positions were liquidated in under 24 hours, with roughly $7 billion of the damage concentrated in a single 40-minute window, making it the largest deleveraging event in crypto history.
Bearish Order Flow Has Dominated Bitcoin Price Action
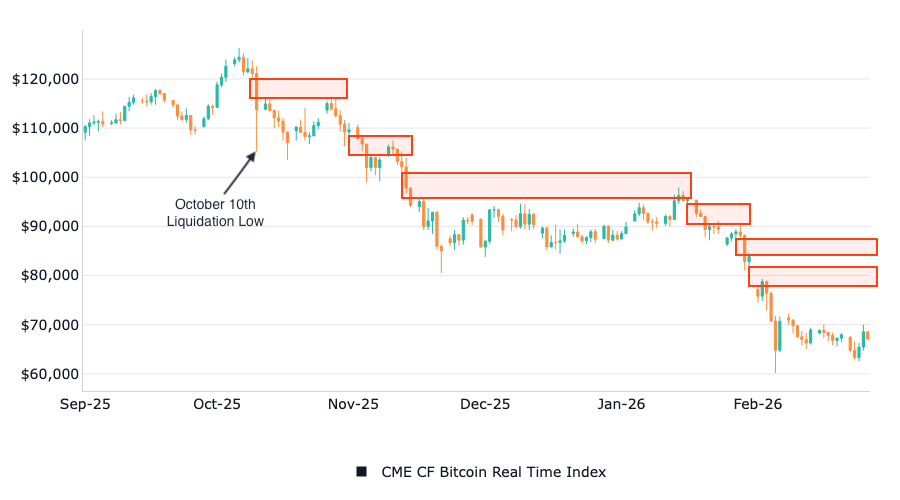
The selling played out in four distinct phases. First, the leverage flush: $20 billion in positions were unwound and futures open interest collapsed 40%. Then came an ETF outflow cascade, with US spot Bitcoin ETFs recording $4.57 billion in outflows over their worst two-month stretch. On January 30, the Warsh Shock hit when Trump's nomination of Kevin Warsh as the next Fed Chair triggered nearly $1 billion in single-day ETF outflows and sent BTC through the $80,000 support level. The final blow came on February 5-6, when BTC briefly plunged below $61,000 before staging a violent bounce.
Bitcoin Fund Flows Since October 10, 2025
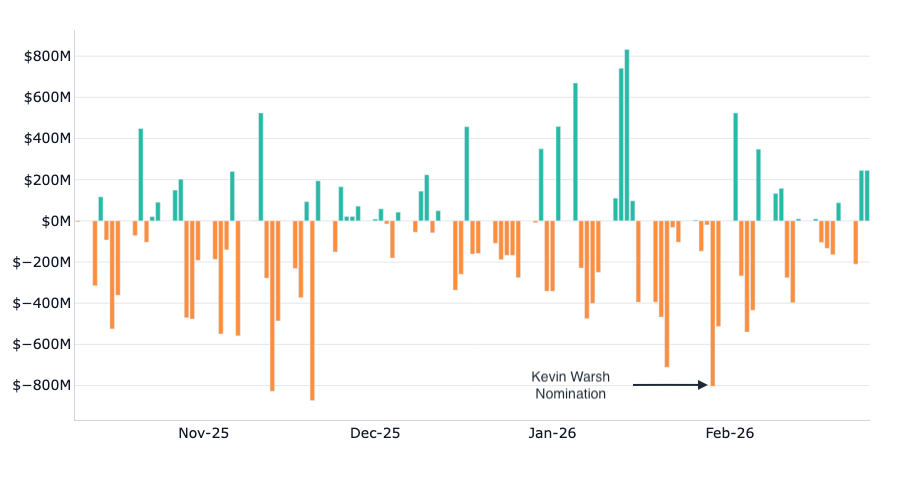
As highlighted in last week's blog [Tracking Bitcoin's Flows], hedge funds de-risked aggressively throughout, with systematic strategies unwinding crypto exposure as trend signals turned negative and volatility-targeting models reduced position sizes. The result: BTC erased its entire post-election rally and then some, falling below its November 2024 Election Day price for the first time. Altcoins fared far worse, with Solana (SOL), Dogecoin (DOGE), and Avalanche (AVAX) suffering drawdowns of 70-86% from their peaks. Today, the market appears to be pricing in a prolonged risk-off environment, but we see four major catalysts that could change the calculus.
1. Recalibration of Monetary Policy
The Warsh nomination was an immediate negative catalyst. Markets read it through his hawkish track record: he opposed rate cuts during the global financial crisis and has historically favored tighter monetary policy and a smaller Fed balance sheet. The initial reaction was unambiguously bearish for risk assets.
But the market may be getting Warsh wrong. His views have evolved considerably since 2008. He now advocates for greater policy easing in 2026, driven by a belief that AI-fueled productivity gains can boost growth without stoking inflation, allowing rates to come down. He has called Bitcoin 'the new gold' for under-40s and has invested in crypto startups. The prevailing narrative, that he is hawkish on the balance sheet but potentially more flexible on rates, leaves room for a dovish surprise.
Several hurdles remain before that surprise can materialize. First, Warsh must be confirmed. His nomination is currently stalled in the Senate Banking Committee, where Republican Senator Thom Tillis has vowed to block any Fed nominees until the DOJ's investigation into Powell is resolved. All eleven Democrats on the committee have echoed that demand. With the committee split 13-12, a single Republican defection is enough to deadlock the process. Second, even once seated, Warsh would need to build consensus on the FOMC to deliver rate cuts, which is no small task for a new chair inheriting a divided board. And third, there is the question of whether Powell steps down when his chairmanship ends in May or remains on the Board of Governors. Historically, nearly all outgoing Fed chairs have resigned their governor seats as well. The last notable exception was Marriner Eccles, who stayed on for three years after being replaced by President Truman in 1948, ultimately playing a key role in establishing modern Fed independence. If Powell were to follow that playbook, it would deny the White House a board majority and complicate Warsh's ability to steer policy.
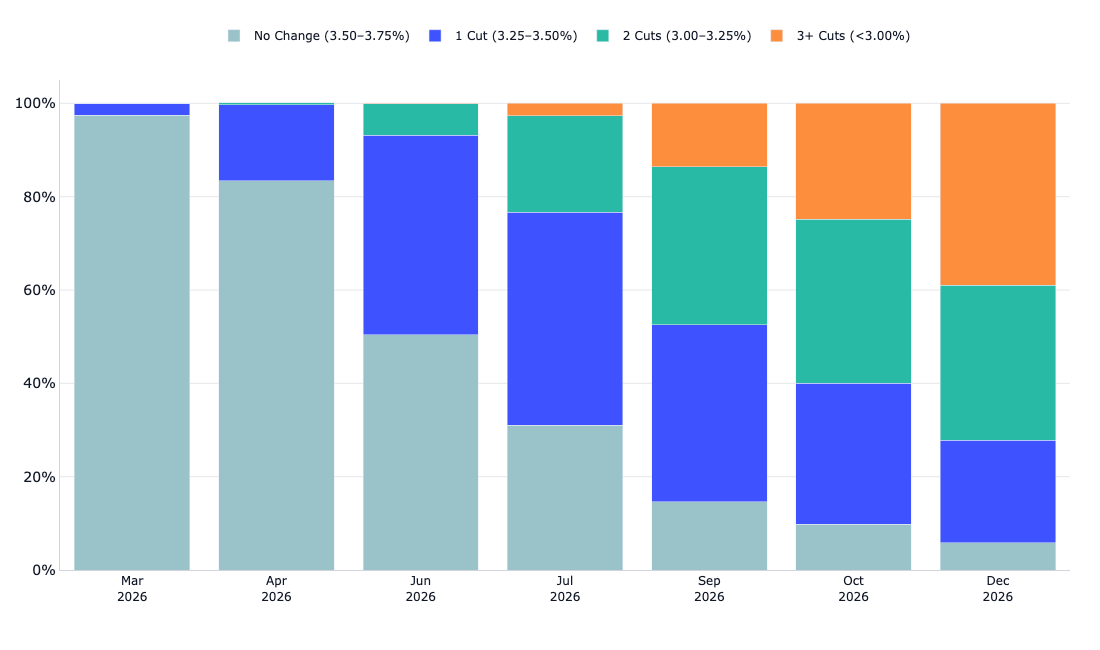
Current market pricing reflects this skepticism. The CME FedWatch tool shows the consensus expects just two 25-basis-point cuts in 2026, likely starting in June. With the Fed funds rate at 3.50-3.75%, futures traders see a terminal rate near 3.0% by year-end. In other words, markets are pricing in a scenario where Warsh is largely unsuccessful in pushing through more aggressive easing. That means any additional cuts beyond two would be a positive surprise, and three or more would be a powerful tailwind that is not currently reflected in market prices.
Markets Are Not Expecting More Than Two Cuts This Year
There is also a less appreciated but equally important development on the balance sheet side. The Fed officially ended its quantitative tightening program on December 1, 2025, earlier than most market participants expected. The decision was driven by emerging frictions in the repo market: bank reserves had fallen to their lowest level since late 2024, and the effective federal funds rate was creeping toward the upper boundary of the policy range. On December 31, the New York Fed provided $74.6 billion through its standing repo facility, the largest cash injection in its history, underscoring how tight liquidity conditions had become.
Fed Balance Sheet
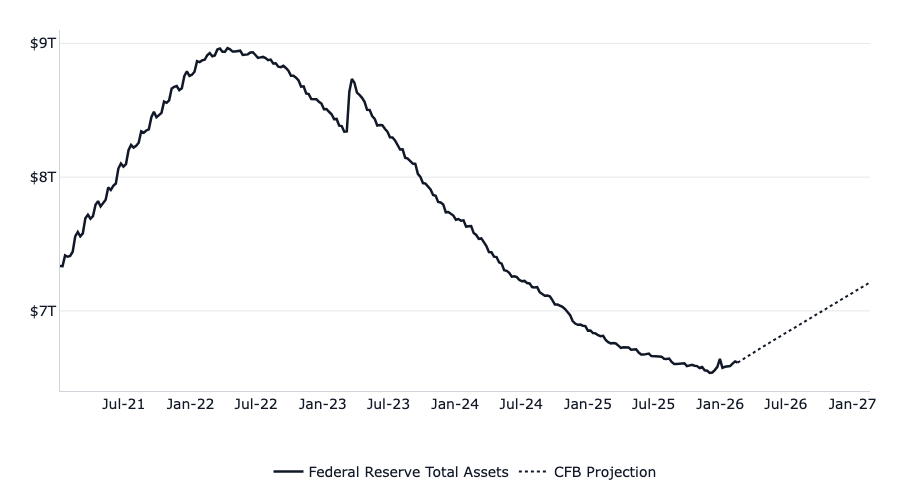
In a notable shift, the Fed has since begun what it calls 'Reserve Management Purchases,' effectively re-expanding the balance sheet to stabilize money-market plumbing. Officials stress this is a technical measure, not stimulus-oriented QE. But for markets, the distinction is less important than the direction: the Fed is adding liquidity, not draining it. The balance sheet has already expanded by approximately $80 billion off its December lows, and in our 2026 Market Outlook, we projected an average expansion of roughly $50 billion per month over the months ahead. This combination of potential dovish surprises on rates plus active balance sheet expansion is not being reflected in market prices.
2. Regulatory Clarity
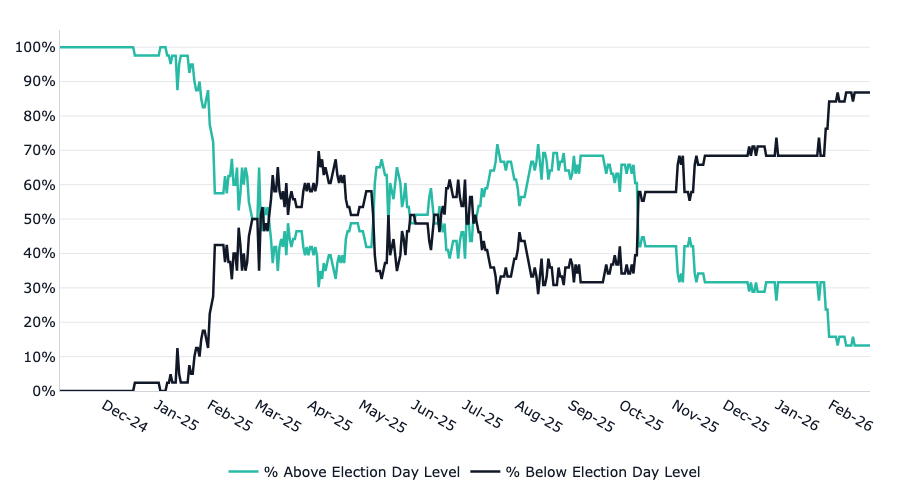
Crypto rallied aggressively after the November 2024 election on hopes of regulatory clarity under a Republican administration. The expectation was straightforward: a pro-crypto White House, a sympathetic Congress, and the long-awaited passage of comprehensive market structure legislation would finally provide the legal framework the industry has been waiting for. But the current price action tells a different story. Most major altcoins and Bitcoin itself are trading below their Election Night levels. One could make the case that the market has not only priced out regulatory upside, but has effectively assigned near-zero probability to the passage of a broad-based market structure bill altogether.
Percentage of Tokens Above and Below Election Day Levels
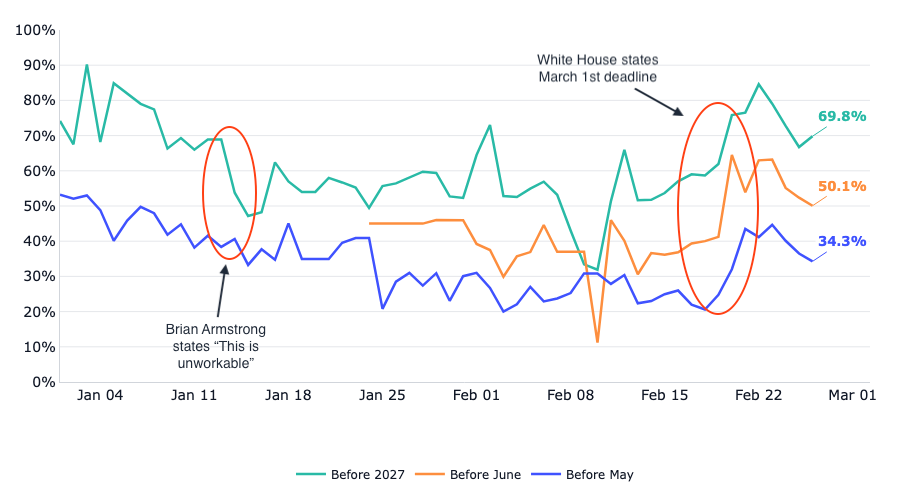
Prediction markets disagree. Polymarket odds for the passage of the Digital Asset Market Clarity Act have swung wildly, from 80% in early January to 50% after Coinbase CEO Brian Armstrong called the draft 'unworkable,' then surging after the White House set a March 1 deadline to advance the bill. As of late February, the 'Before 2027' contract sits at roughly 70%, the 'Before June' contract at 50%, and the 'Before May' contract at 34%, suggesting markets see passage as likely but are uncertain on timing. Kalshi, using a broader framing of 'crypto market structure legislation,' prices passage at roughly 68%. The disconnect between these probabilities and the near-zero regulatory premium in token prices represents one of the most compelling asymmetries in the market.
CLARITY Act Passage Odds on Kalshi
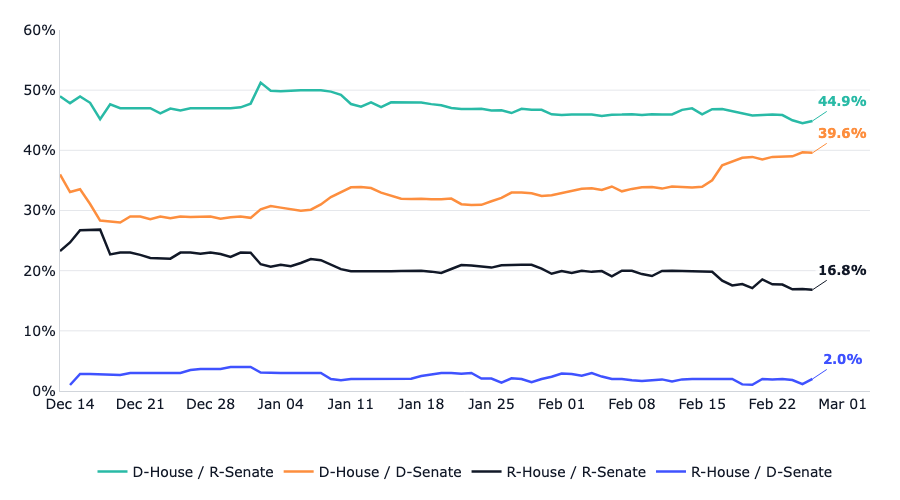
Time, however, is of the essence. The 2026 midterm election dynamics create a 'now or never' window for crypto legislation. Prediction markets paint a stark picture: the two most likely outcomes for the 2026 midterms are a Democratic House with a Republican Senate (44.9%) and a Democratic sweep of both chambers (39.6%), while the probability of Republicans retaining the House sits at just 16.8%. Taken together, markets price roughly an 85% chance that Democrats win the House, with Republican odds collapsing to just 15%. Special elections have already indicated a shift in the balance of power, and Treasury Secretary Bessent has explicitly cited the midterm calendar as a reason for urgency.
Pricing in the Balance of Power in 2026
If Democrats recapture the House, the priorities of the committees overseeing digital assets would shift dramatically. The window for pro-crypto legislation under the current Congress is narrowing, which paradoxically increases the probability of passage in the near term, as both parties recognize the incentive to act before the political landscape shifts. While we do not expect the March 1 deadline to hold, we still anticipate a bill advancing before June as midterm pressures intensify.
3. Capitulation and Seller Exhaustion Signals
Bottoms are not called, they are built. And the building blocks of a bottom are becoming visible in the volatility markets.
The CME CF Bitcoin Volatility Index (BVX), derived from CFTC-regulated Bitcoin options with nearly $46 billion in equivalent notional value traded in 2025, provides the clearest window into market stress. During the February 5-6 capitulation, the CME CF Bitcoin Volatility Index surged from just over 40 to 95, which is likely the highest rate of change for this index since other black swan events like FTX.
Bitcoin Implied and Realized Volatility
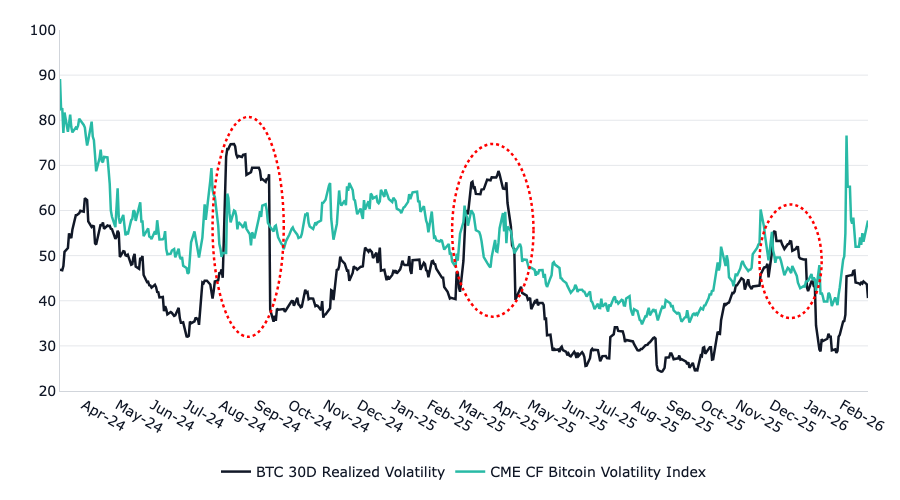
The key signal to watch is the relationship between implied and realized volatility. When implied volatility spikes sharply above realized volatility during a selloff, it signals that options markets are pricing in extreme fear that exceeds the actual pace of price movement. The chart above illustrates this dynamic clearly: the red circles highlight prior episodes where implied volatility diverged sharply from realized volatility, and in each case, the gap eventually compressed as selling pressure faded and prices stabilized. As that implied volatility premium compresses, particularly if prices stabilize while the BVX falls back from elevated levels, it historically signals seller exhaustion and a potential inflection point. This pattern preceded most major trend reversal in past crypto cycles.
Today we are seeing the same setup. The combination of an all-time-low Fear & Greed reading of 0.13 and BVX extremes as one of the strongest contrarian signals in crypto history. The question is not whether the volatility premium will compress, but whether it will compress alongside price stabilization, which is the hallmark of a genuine bottom, or alongside further downside.
Another exhaustion signal is emerging in the breadth data. The chart below shows the percentage of CF Broad Cap Index constituents hitting new 52-week lows alongside the index itself. In equity markets, this is one of the most well-established breadth indicators for identifying potential bottoms. The logic is straightforward: during a selloff, the percentage of constituents making new 52-week lows spikes as selling pressure sweeps broadly across the market. But as the decline matures, fewer and fewer names make new lows even as the index continues to drift lower or chop sideways. That divergence, a falling percentage of new lows while the index stabilizes, signals that the weakest hands have already been flushed and selling pressure is becoming concentrated rather than broad-based.
Selloff Drives Record Share of Constituents to 52-Week Lows
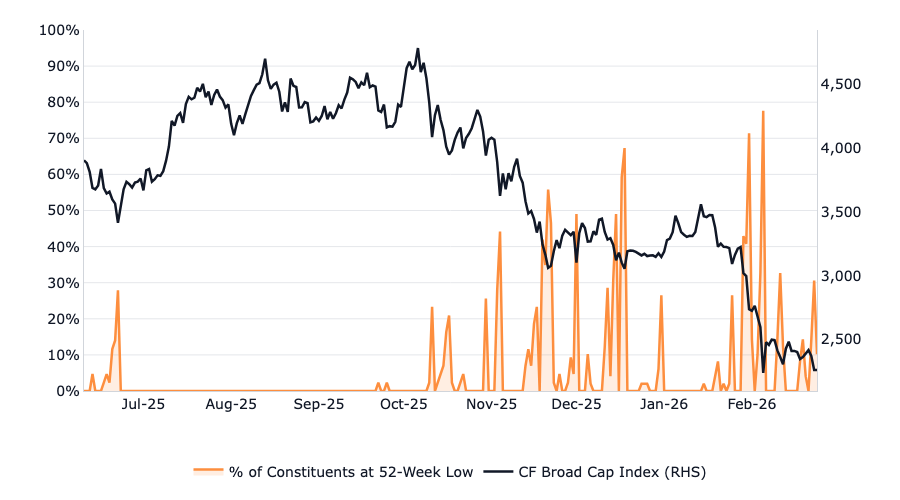
This pattern has been a reliable precursor to trend reversals in equities for decades. The same dynamic might be playing out in crypto. During the February 5-6 capitulation, over 75% of CF Broad Cap Index constituents were simultaneously hitting new 52-week lows, an extreme reading that reflects near-universal selling pressure across the digital asset market. That level of breadth deterioration is rare and historically unsustainable. Notably, as the index has stabilized in the weeks since, the percentage of constituents making new lows has already begun to recede. If this trend continues, with the new-low percentage declining even as the index holds near current levels, it would be a textbook seller exhaustion signal and another building block in the case that a bottom is being formed.
4. Altcoin Leadership & Factor Rotations
In prior crypto cycles, the earliest stages of a recovery have been marked by a shift in market leadership. Higher-risk, lower-liquidity tokens tend to show relative outperformance as risk appetite returns, a dynamic that is the inverse of the 'flight to quality' pattern that dominates during selloffs, when capital concentrates into Bitcoin
Ratio of CF Diversified Broad Cap to Free Float Broad Cap
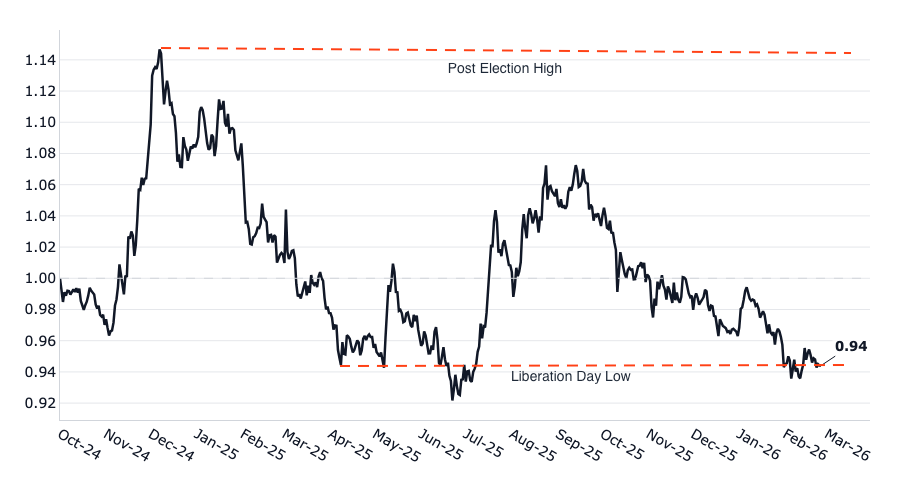
One way to measure this dynamic is the ratio of the CF Diversified Broad Cap Index to the Free Float Broad Cap Index. When this ratio is rising, it signals that equal-weighted, diversified exposure is outperforming market-cap-weighted exposure, meaning smaller and mid-cap tokens are pulling their weight relative to the large-cap names that dominate the free float index. When the ratio is falling, it tells us the opposite: capital is concentrating into the largest names while the broader market deteriorates. As the chart shows, this ratio peaked shortly after the November 2024 election at 1.14, reflecting broad-based optimism across the market. It has since fallen steadily to 0.94, breaking below its Liberation Day low and hitting a new trough. This tells us that the current selloff has been especially punishing for the long tail of the crypto market, with smaller tokens underperforming the largest names by a widening margin.
CF Benchmarks factor data should echo this dynamic as a recovery takes shape. The chart below shows long-short factor portfolio performance since the October 10 selloff, standardized to 100. The pattern is consistent with a market still firmly in risk-off mode. Downside Beta has been the clear outperformer, surging to nearly +10% by late February, meaning a strategy that is long low-downside-beta tokens and short high-downside-beta tokens has returned roughly 10% since the selloff began. Value has also held up well, hovering around +2-3% for much of the period. In other words, the most defensive and cheapest names in the market have been consistently rewarded. On the other side, Growth has been the weakest factor by a wide margin, falling approximately -8%, representing the largest negative return among all factors. Size has also underperformed, dropping roughly -4%, confirming that smaller-cap tokens have lagged their larger peers. Notably, Downside Beta's outperformance accelerated sharply in February, diverging further from Growth and Size at exactly the moment the broader market was capitulating. This is the factor fingerprint of a bear market: defensive positioning dominates while risk-seeking factors lag.
Factor Performance Since October 10, 2025
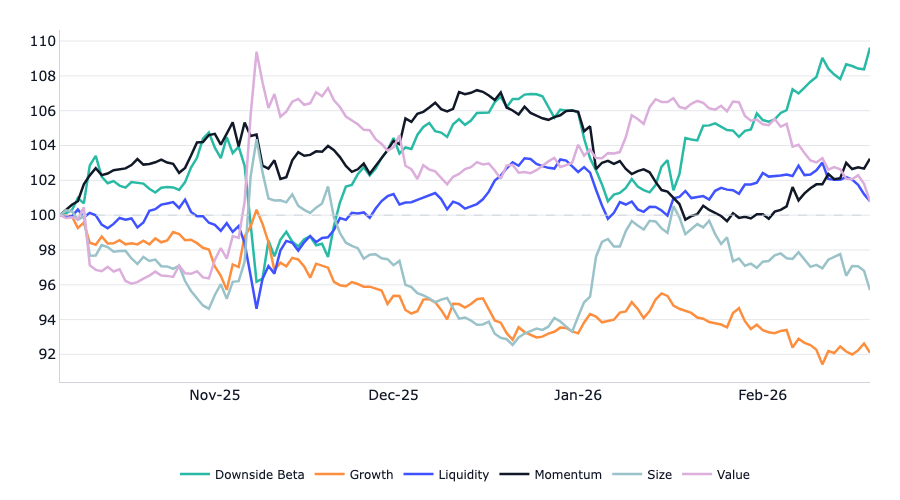
The signal to watch for is a reversal of this pattern. In a genuine recovery, we would expect to see capital rotate out of Downside Beta and into Growth and Size as investors begin reaching further out on the risk curve. A sustained period where Growth and Size rise back toward and above 100 while Downside Beta fades would be one of the earliest, data-driven confirmations that risk appetite is returning to the broader market, not just to Bitcoin. Monitoring these factor exposures will provide an objective signal of whether the rotation is genuine or merely noise.
The Bottom Line
Crypto winter is painful, but it does not last forever. The deleveraging cycle has run its course. Sentiment sits at historical extremes. The Fed is quietly adding liquidity. And a series of catalysts with asymmetric risk-reward profiles are lined up: a potential dovish surprise from Warsh that markets are not pricing in, the CLARITY Act advancing through a narrowing legislative window before midterm dynamics shift the political calculus, seller exhaustion signaled by volatility and breadth indicators at levels rarely sustained in past cycles, and the early-stage rotation dynamics that have preceded every prior recovery.
The question is not whether crypto spring will arrive, but when, and what will trigger the turn. Absent an unforeseen black swan or geopolitical shock, these are the four things we are watching most closely.
The information contained within is for educational and informational purposes ONLY. It is not intended nor should it be considered an invitation or inducement to buy or sell any of the underlying instruments cited including but not limited to cryptoassets, financial instruments or any instruments that reference any index provided by CF Benchmarks Ltd. This communication is not intended to persuade or incite you to buy or sell security or securities noted within. Any commentary provided is the opinion of the author and should not be considered a personalised recommendation. Please contact your financial adviser or professional before making an investment decision.
Note: Some of the underlying instruments cited within this material may be restricted to certain customer categories in certain jurisdictions.
Factor Friday - July 24, 2026
Beta's four-week grind higher stalled this week as style leadership rotated again: Momentum took the top spot, last week's leader Value fell to the bottom, and Growth stayed July's weakest factor. Size remains the only style factor positive on the year; beta, not style selection, is setting returns.

Mark Pilipczuk
Changes to the Token Market Price Benchmarks Series - Market Prices – 21 July 2026
The Administrator has confirmed changes to the Token Market Price Family for the period 14 July 2026 to 21 July 2026.
CF Benchmarks
Softer CPI Reprices July Hike Risk & Lifts Digital Assets
Digital assets extended their recovery over the past week as cooler US inflation prints repriced Fed expectations; the bid was broad across the large cap indices, growth factor leadership returned, stablecoin funding repriced lower, and stress stayed isolated in names hit by token-specific news.
Mark Pilipczuk
By clicking Accept, you consent to CF Benchmarks's use of cookies.
Visit Cookie Settings to learn how CF Benchmarks uses cookies and to adjust your preferences.