
May 02, 2026
Fragile Peace, a Fractured Fed, and a Tentative Bounce
Key takeaways for the month
Macro, geopolitical, and policy crosscurrents shifted decisively in April as a U.S.-brokered Iran ceasefire, reached mid-month after the February 28 outbreak, triggered a coordinated relief rally across risk assets. Crude retraced from March highs, although with the Strait of Hormuz still largely closed, the easing war premium offered only partial relief from the lingering inflationary impulse. The Federal Reserve held rates steady on April 29 in Chair Jerome Powell's final FOMC meeting. The decision was hardly unified: an 8-to-4 dissent, the most fractured FOMC vote since 1992, underscored disagreement over the disinflation path. The Senate Banking Committee advanced Kevin Warsh's nomination to succeed Powell that same day on a 13-to-11 party-line vote. Bitcoin posted its best monthly gain in a year, leading a digital asset rebound as spot Bitcoin ETFs registered their largest inflows of 2026 and stablecoin liquidity expanded. With the ceasefire fragile and a Fed transition underway, investors stepped off the defensive crouch but kept dry powder for the next inflection.
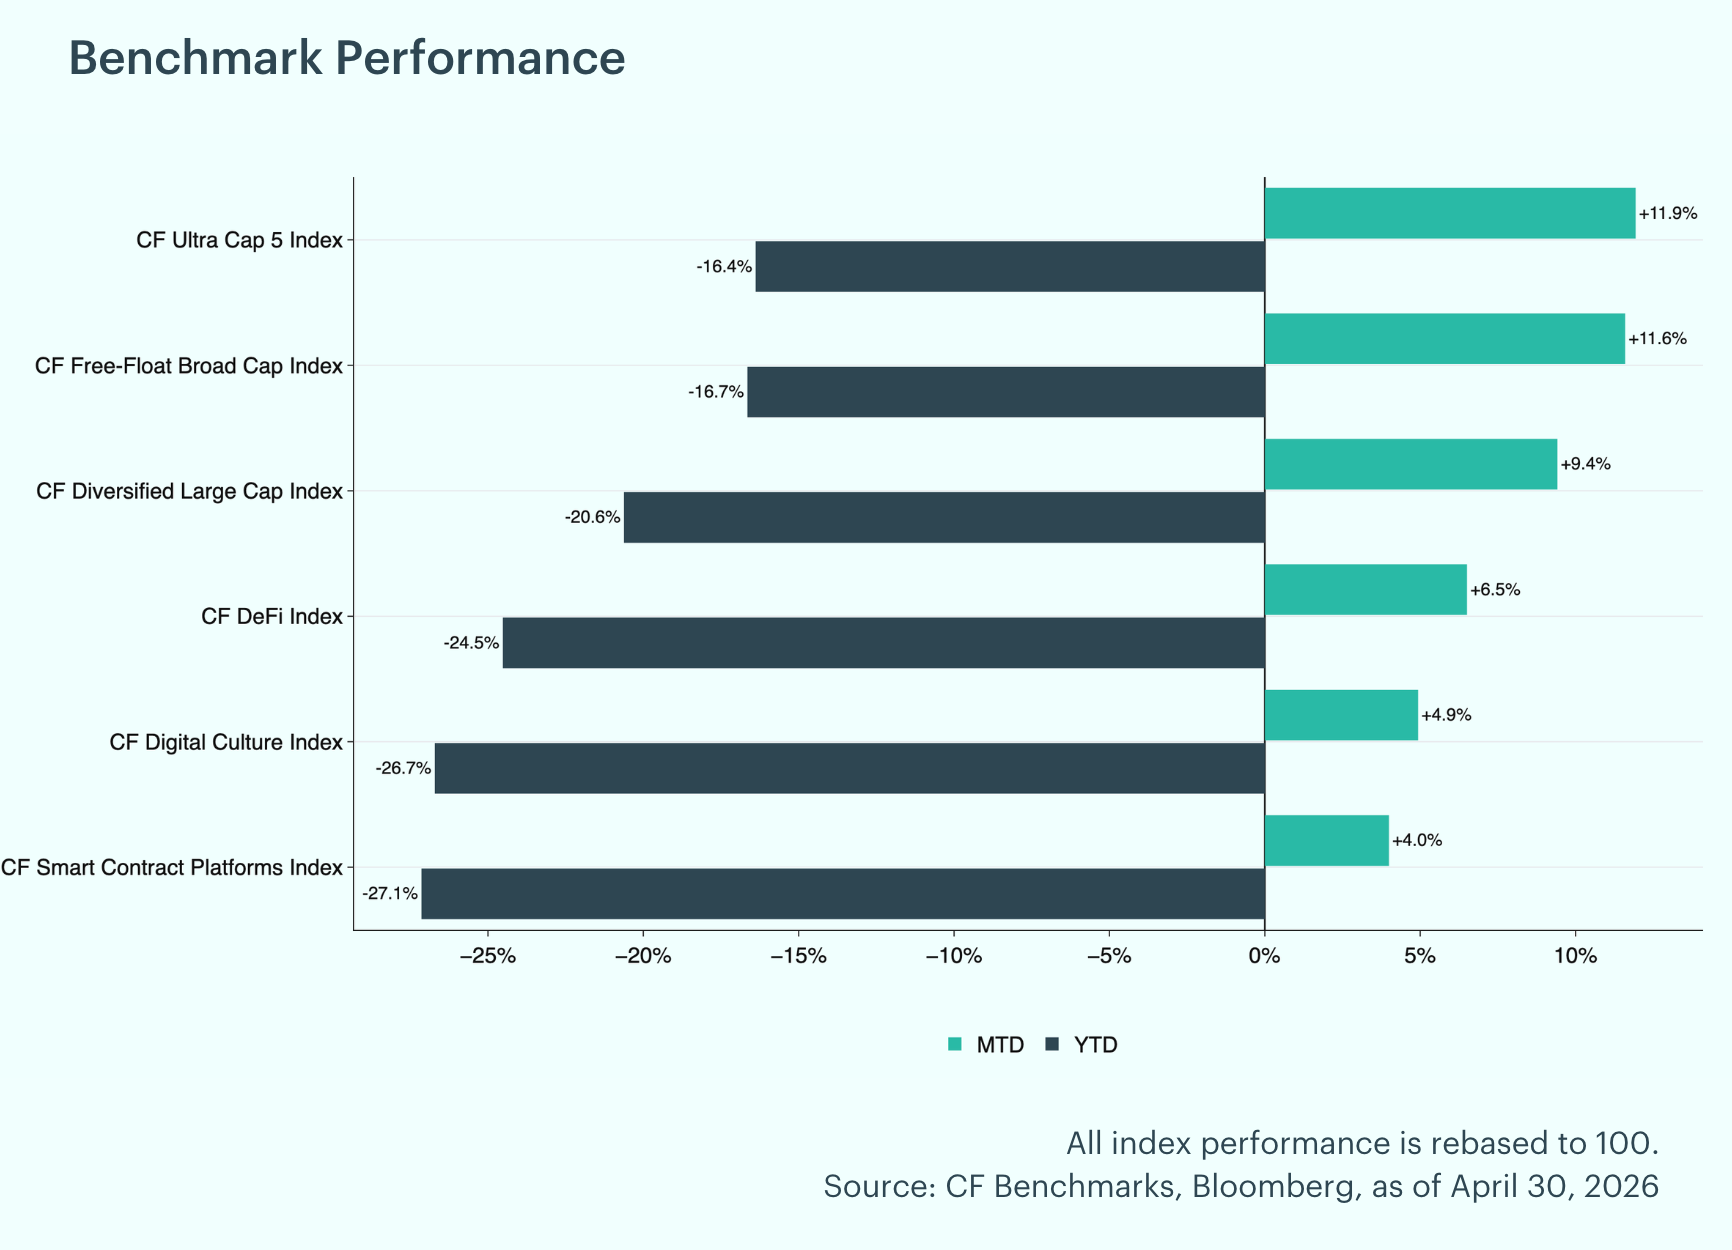
Coordinated Rebound Across the Market: April's price action delivered a broad rebound across digital assets, with every CF Benchmarks index posting positive monthly returns. The CF Ultra Cap 5 Index led to the upside, rising 11.9% month-to-date, with the CF Free-Float Broad Cap and CF Diversified Large Cap indices close behind at 11.6% and 9.4%, respectively. The CF DeFi Index gained 6.5%, while the CF Digital Culture Index rose 4.9% and the CF Smart Contract Platforms Index added 4.0%. On a year-to-date basis, drawdowns narrowed but losses persist, with the CF Diversified Large Cap Index off 21% and the other indices ranging between 16% and 27%.
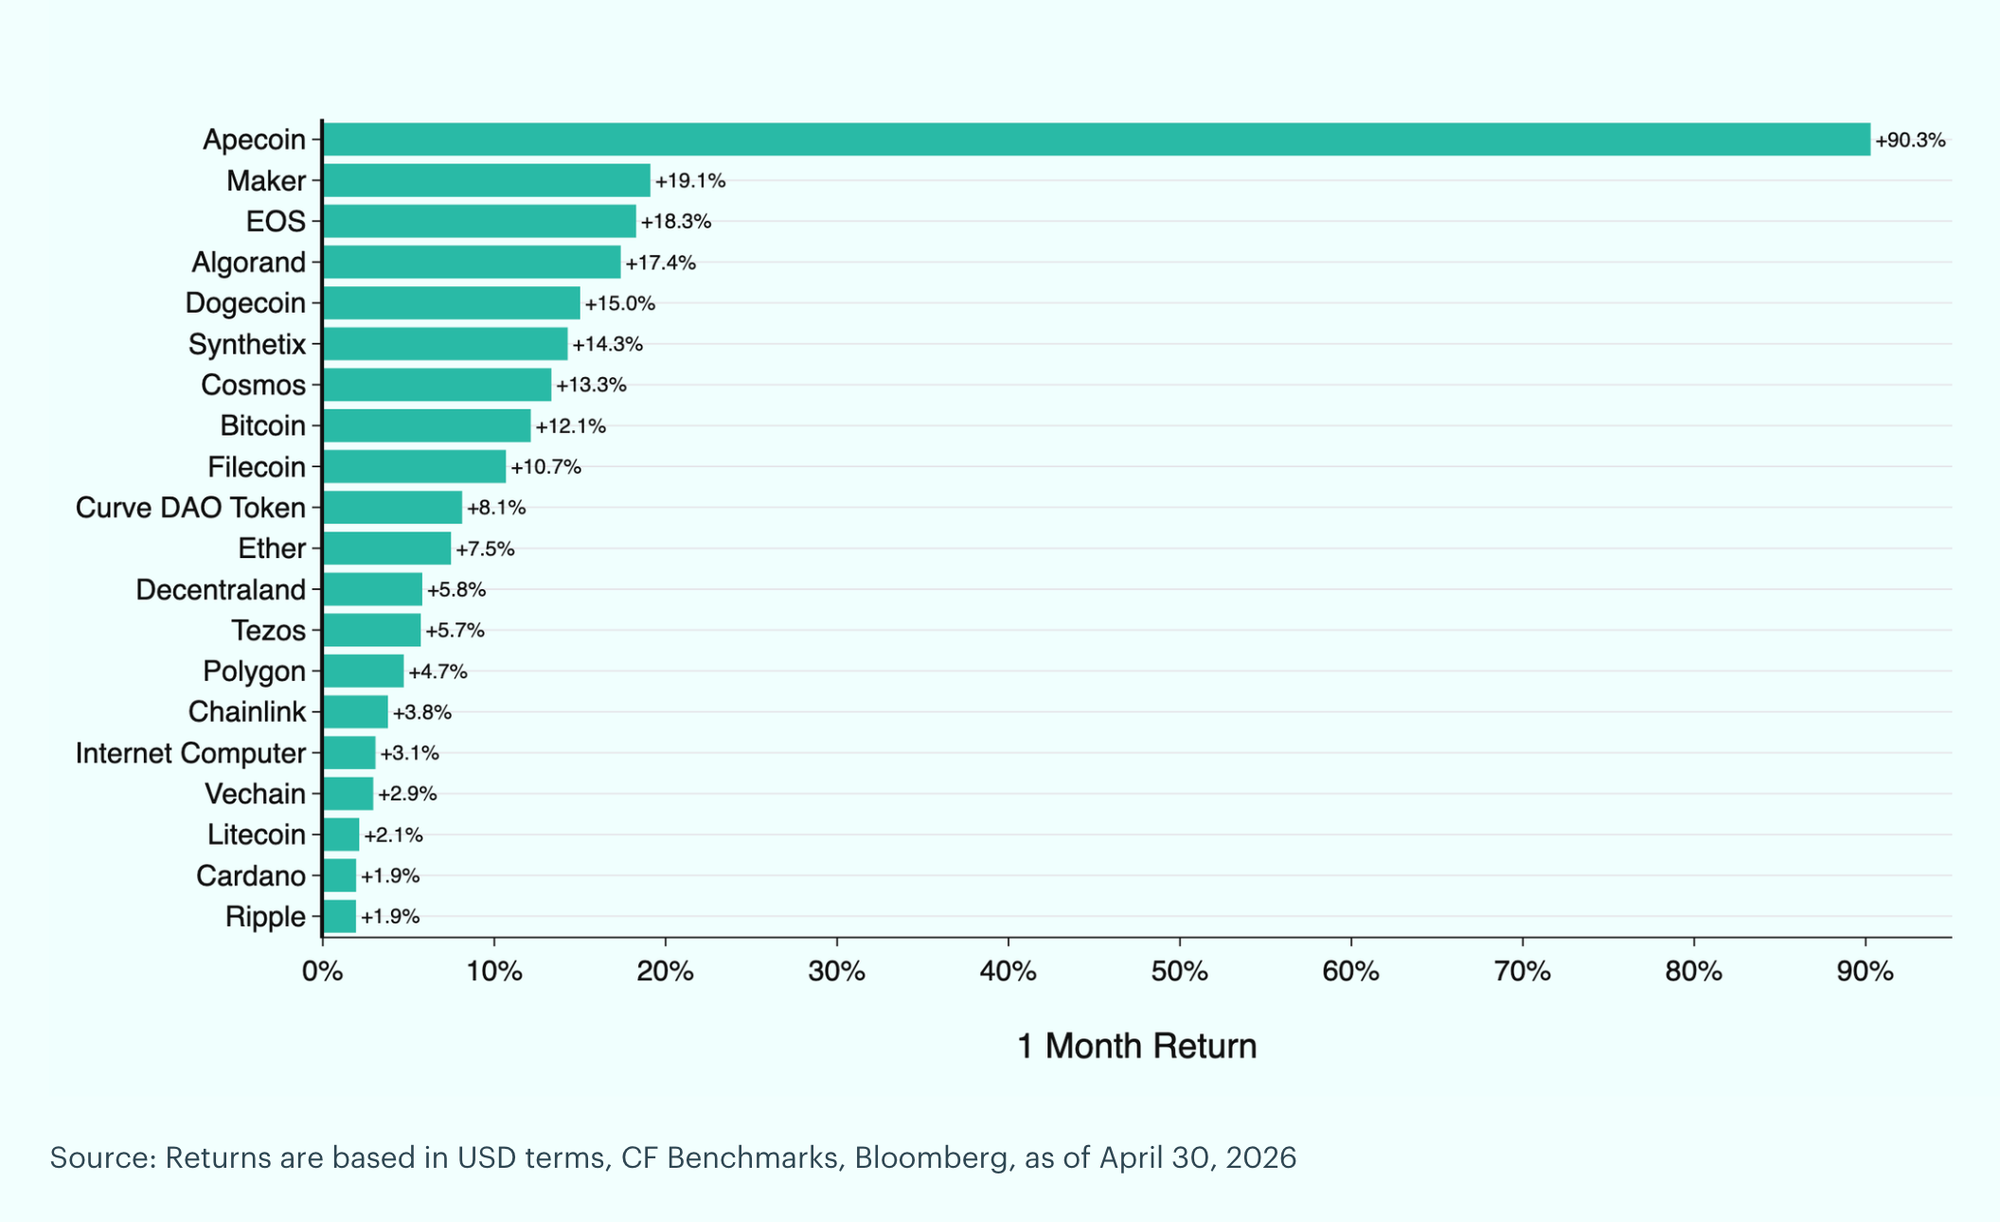
Individual Movers: Apecoin (APE) led April's major crypto performers with an exceptional 90.3% gain, supported by renewed activity across the Yuga Labs ecosystem and a slight recovery in NFT and digital culture sentiment. Maker (MKR) followed at +19.1%, lifted by accelerating Real World Asset adoption and strong DAI demand, with the Smart Burn Engine reinforcing token value accrual. EOS rounded out the leaders at +18.3%, benefiting from continued progress on the Antelope framework and renewed speculative interest in deep-value Layer-1 platforms. Ripple (XRP) was the smallest gainer in the top 20 at +1.9%, lagging as flows rotated toward higher-beta names. Cardano (ADA) followed at +1.9%, held back by slower ecosystem traction relative to peer Layer-1s. Litecoin (LTC) trailed at +2.1%, underperforming as the pure-payments thesis drew less attention during a DeFi- and metaverse-led rebound. Source: Returns are based in USD terms, CF Benchmarks, Bloomberg, as of April 30, 2026.
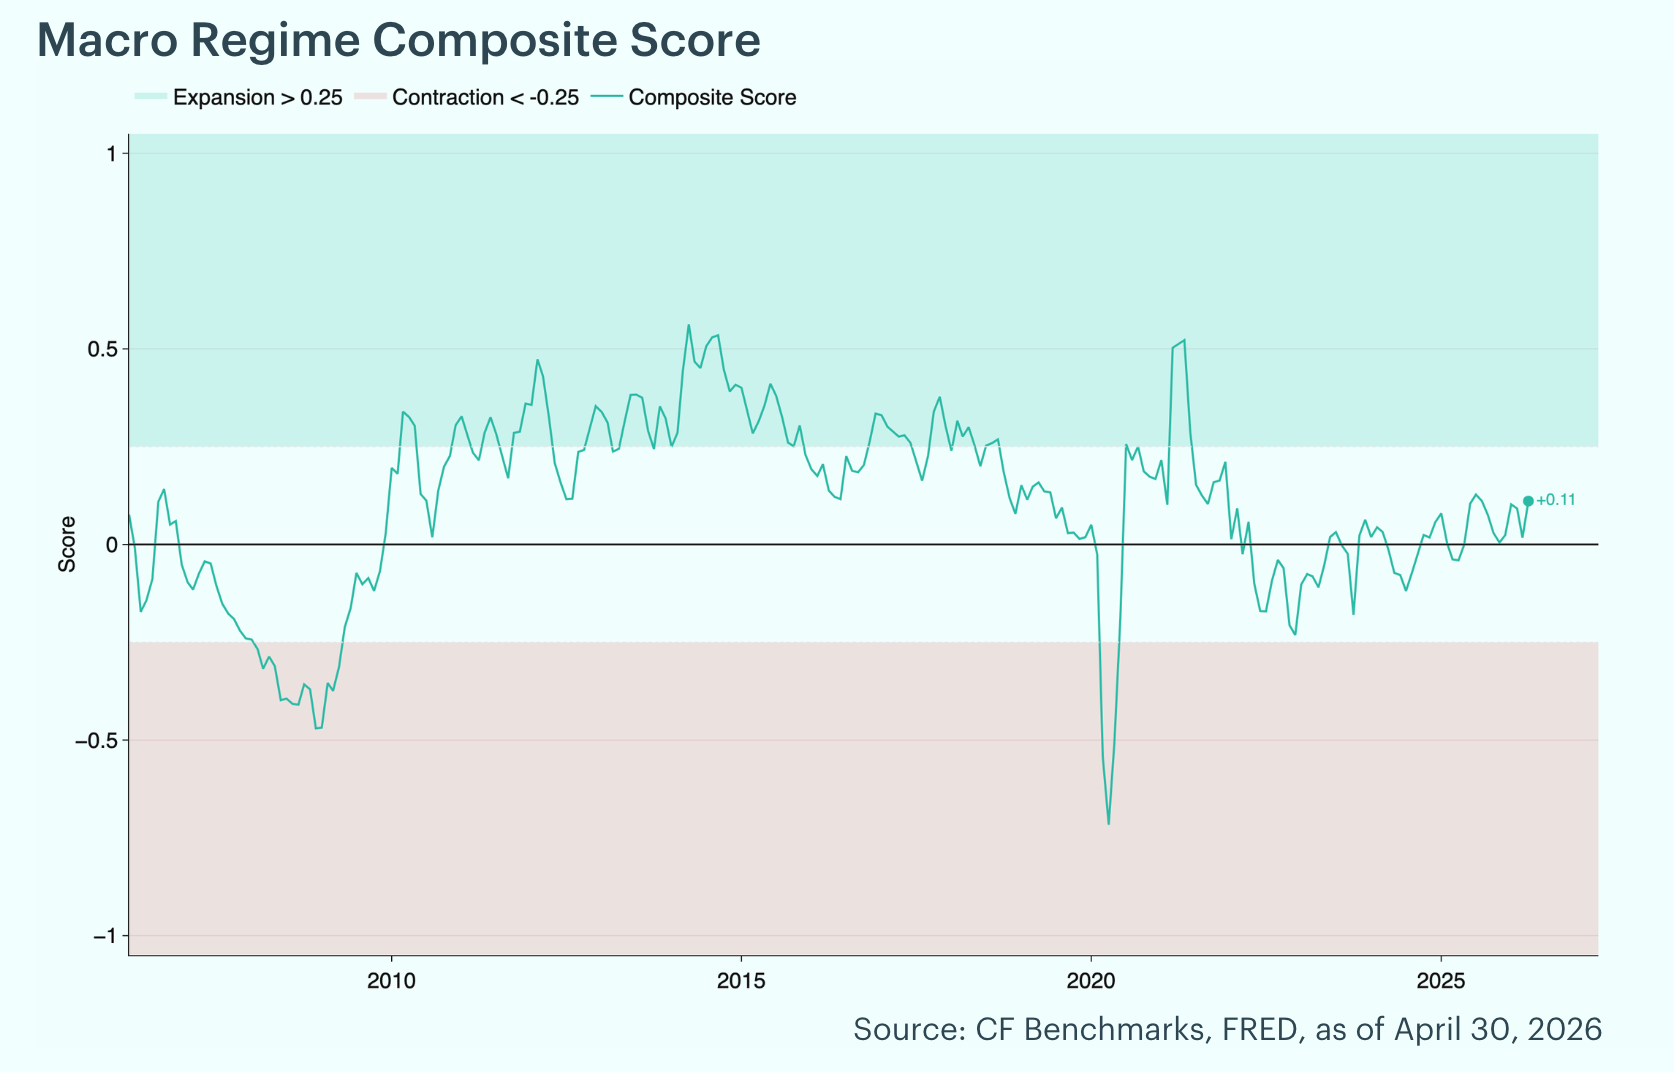
Mixed Macro Regime: The CF Benchmarks Macro Regime Dashboard tracks 24 leading, coincident, financial conditions, and published composite indicators to gauge the state of the U.S. business cycle. Each indicator is normalized into a signal between -1 and +1 based on its level and short-term direction, then aggregated into category scores that feed a single composite score. The composite classifies the regime as Strong Contraction, Contraction, Mixed, Expansion, or Strong Expansion. As of April, the composite advanced to 0.11, with the regime classification remaining in Mixed territory. The improvement was driven primarily by easing financial conditions and a rebound across leading indicators, with high-yield credit spreads tightening and the S&P 500 six-month change moving solidly positive. Two indicators continued to flash warning signs, however. Heavy Truck Sales, a classic late-cycle freight indicator, fell 19.9% year-over-year to a 367k seasonally adjusted annual rate, registering a Strong Contraction signal. The U. Michigan Consumer Sentiment Index dropped to 53.3 from 56.6, also a Strong Contraction reading, reflecting growing household concern about inflation persistence and labor market softness.
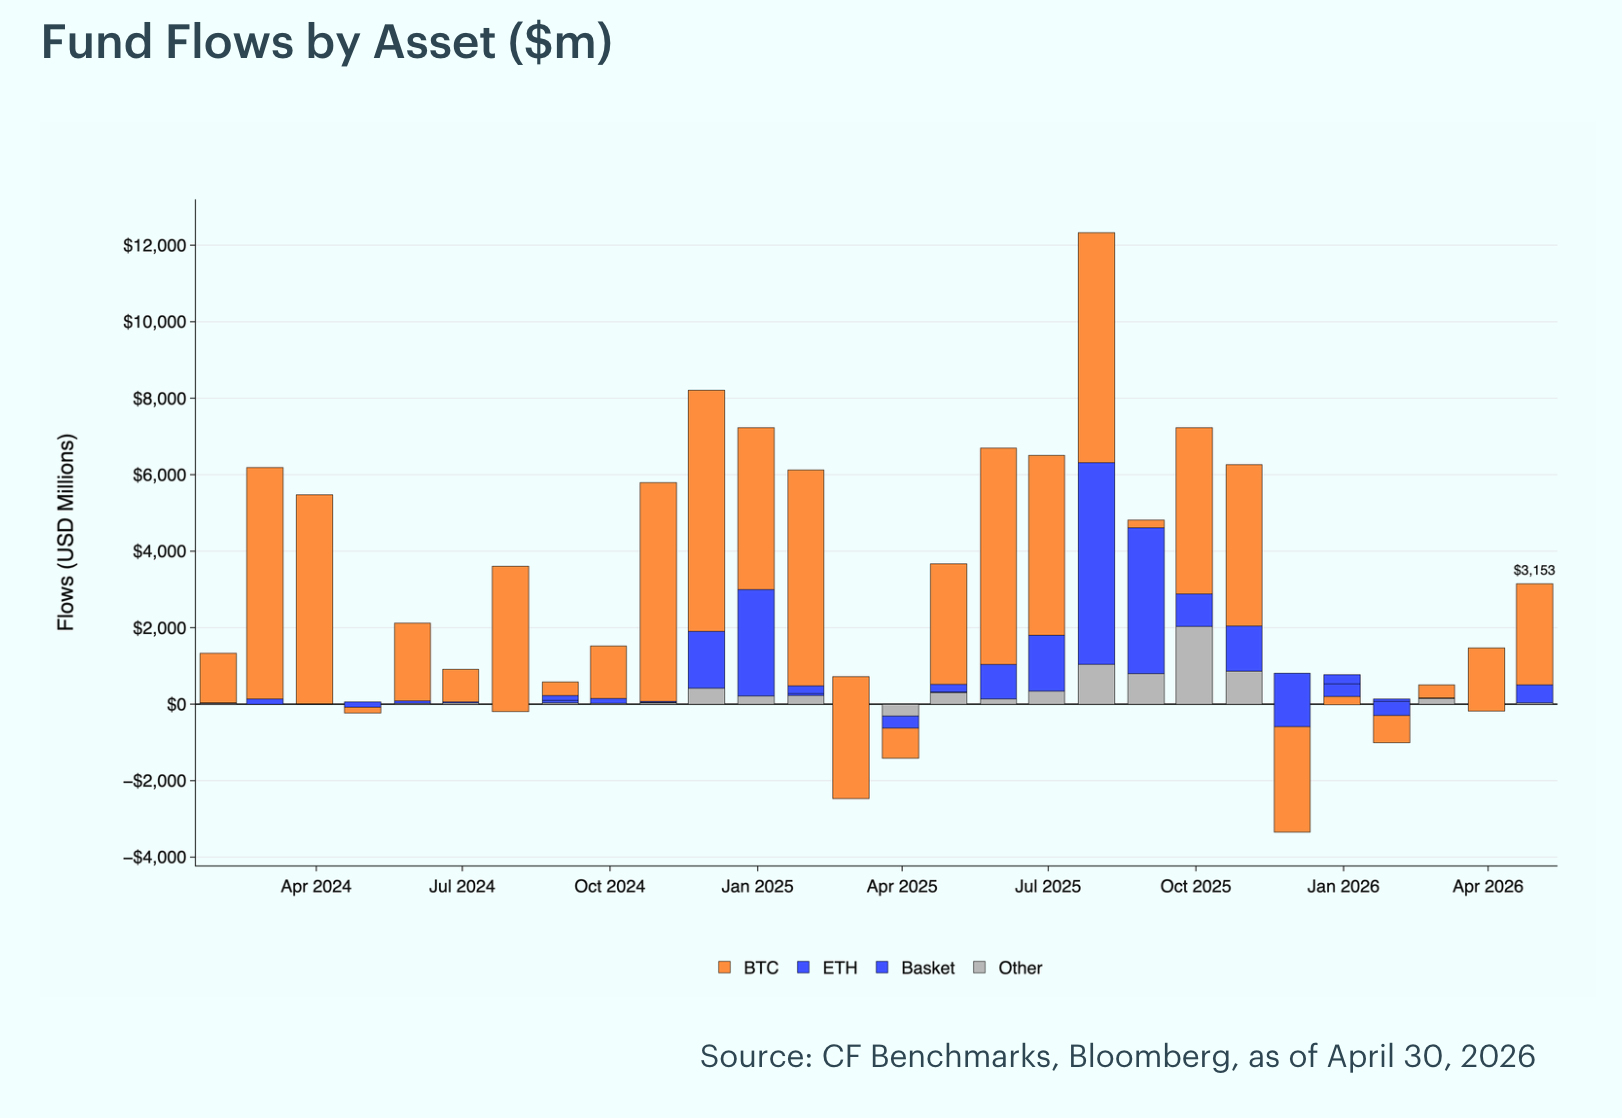
Fund Flows Hit 2026 High: April was a strong month for fund flow activity, with digital asset funds attracting approximately $3.2 billion in net inflows, the largest monthly haul of 2026 and a sharp acceleration from March's $1.5 billion. Bitcoin funds captured the bulk of demand at $2.6 billion, while Ether funds reversed prior weakness with $472 million in inflows. Other Single Crypto funds added $43 million, while Basket/Index funds saw a marginal $6 million in outflows. Regionally, flows were dominated by North America at $3.4 billion, with Europe contributing $44 million, Asia Pacific adding $8 million, and South America registering $3 million.
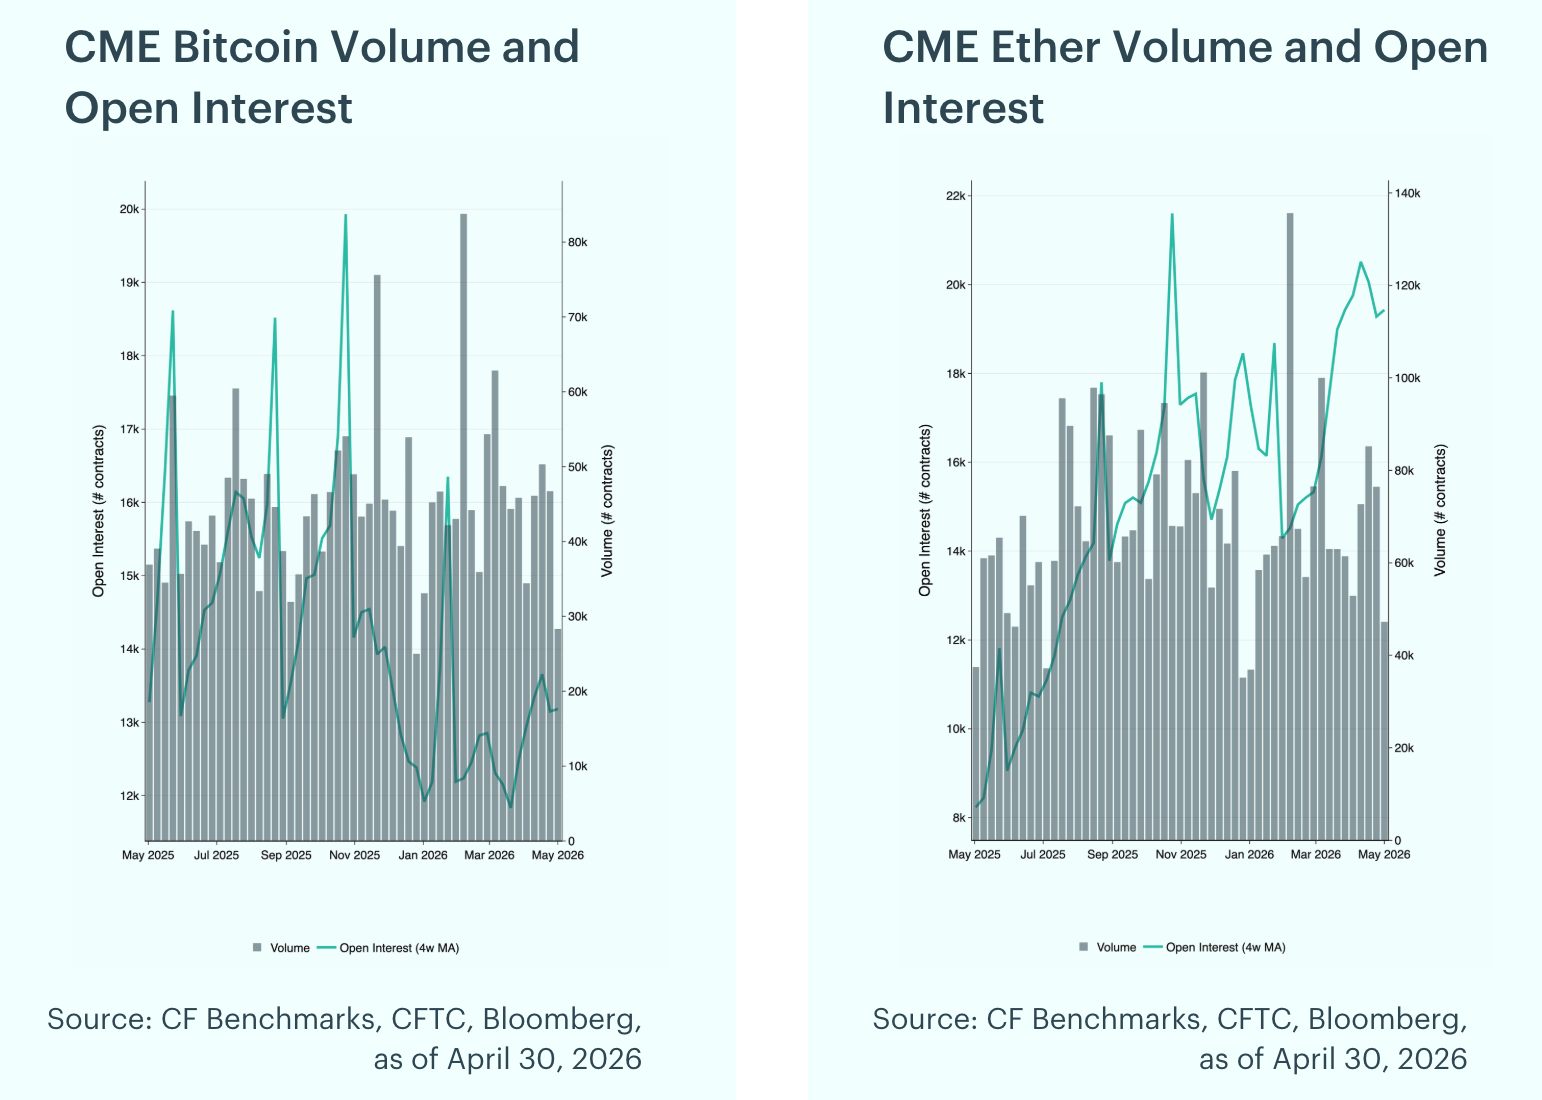
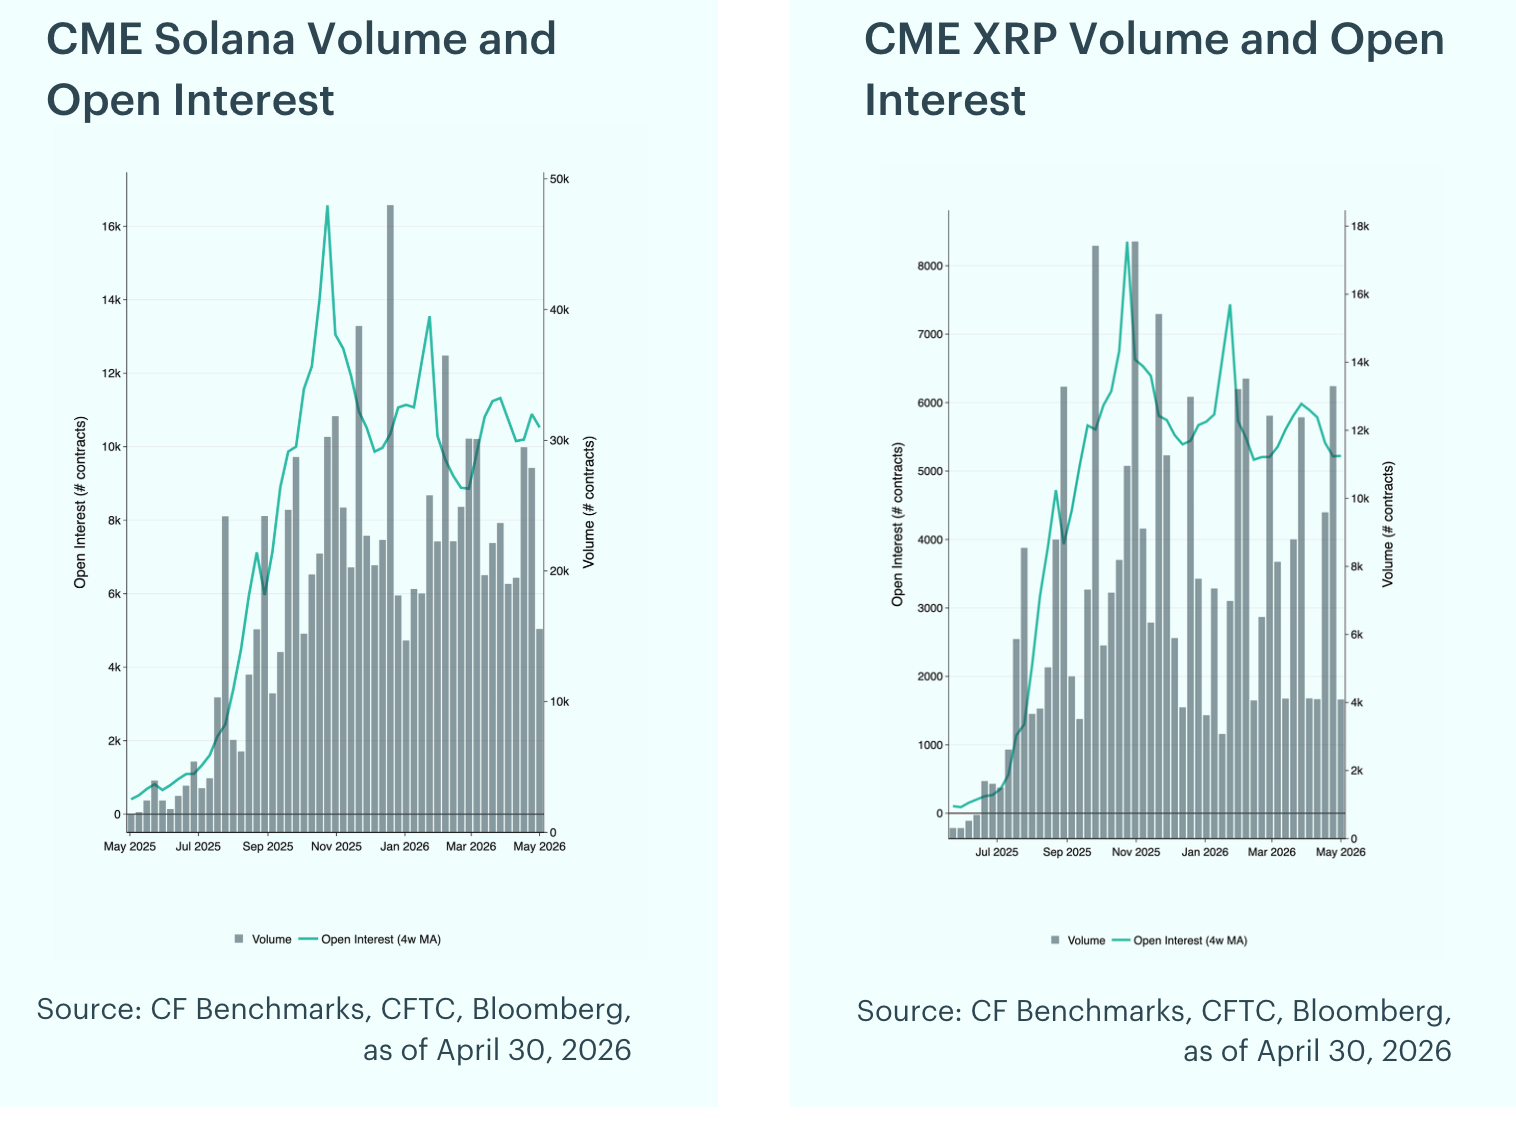
Futures Positioning Diverges: In April, open interest moderated across most contracts as the relief rally proceeded with measured positioning. Bitcoin open interest rose 5.6% to 13,182 contracts, while Ether held essentially flat at 19,430. Solana declined 7.1% to 10,524 contracts and XRP fell 12.7% to 5,222 contracts as the prior month's leverage build-up unwound. Peak weekly volumes were concentrated mid-month: Bitcoin reached 50,290 contracts, Ether 85,161 contracts, and Solana 29,454 contracts, while XRP volume peaked later in the month at 13,294 contracts.
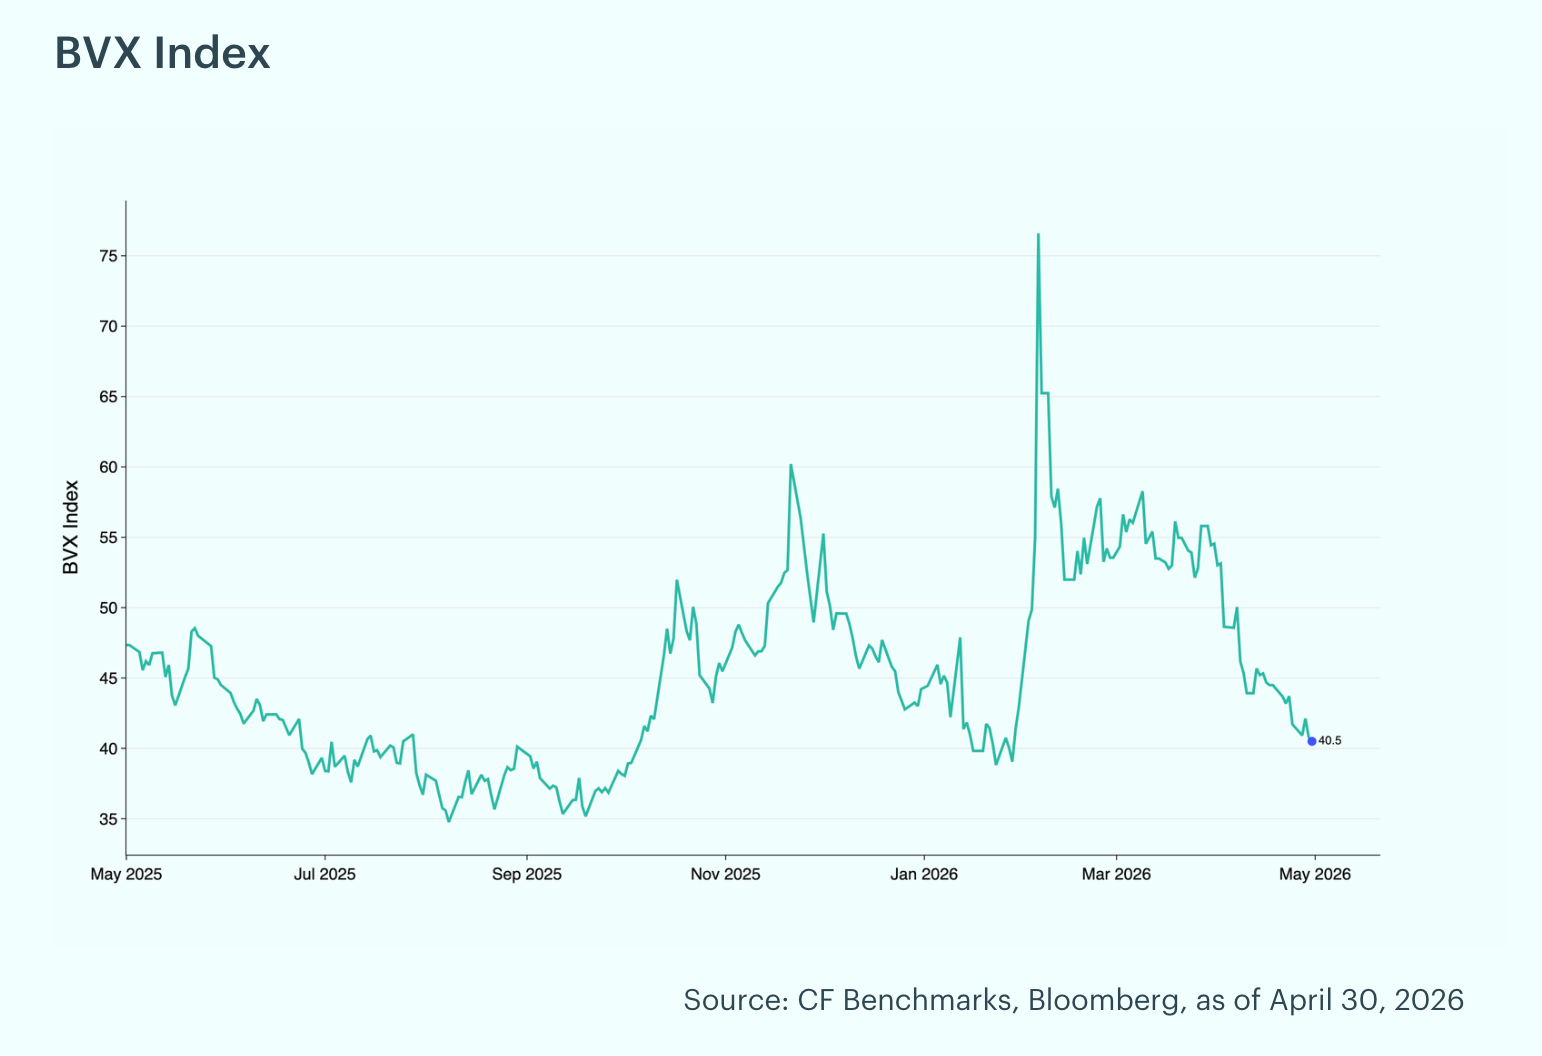
Bitcoin Volatility Compresses to a One-Year Low: The CF Bitcoin Volatility Index Settlement Rate (BVXS) is a daily benchmark that provides a forward-looking, 30-day constant-maturity measure of implied volatility, derived from CFTC-regulated Bitcoin option contracts traded on the CME. The BVX reflects the fair strike of a variance swap. The BVX ranged from 40.50 to 53.14 in April, closing the month at 40.50, the lowest level in over a year. The z-score remained deeply negative throughout the month, ranging from -3.19 to -0.98, indicating implied volatility was substantially below recent norms as the relief rally took hold.
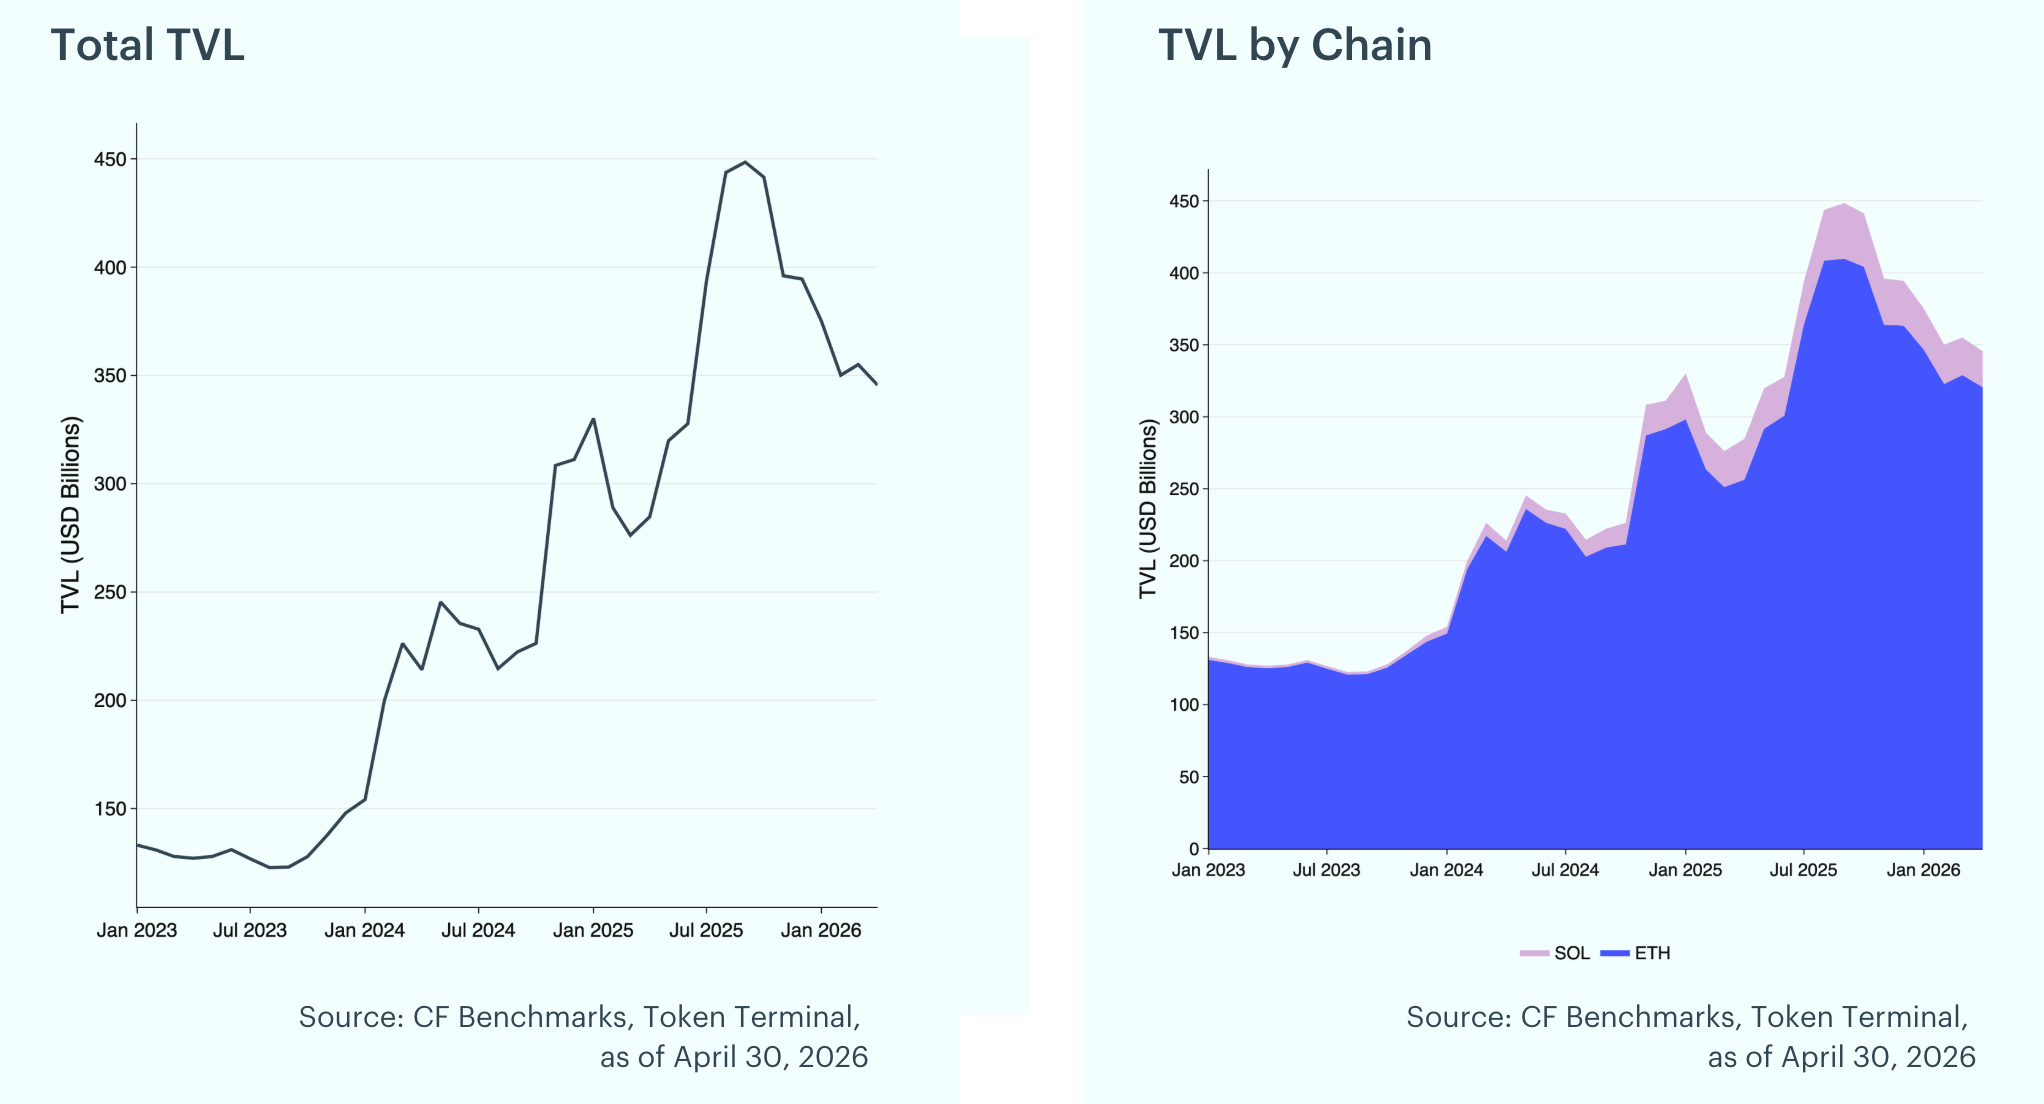
DeFi TVL Edges Lower: Total Value Locked declined 2.7% in April to $345.5B, down from $355.0B in March. Ethereum TVL fell to $320.7B (-2.5%) while Solana TVL declined to $24.9B (-4.3%) as on-chain activity softened despite the broader risk-asset rally.
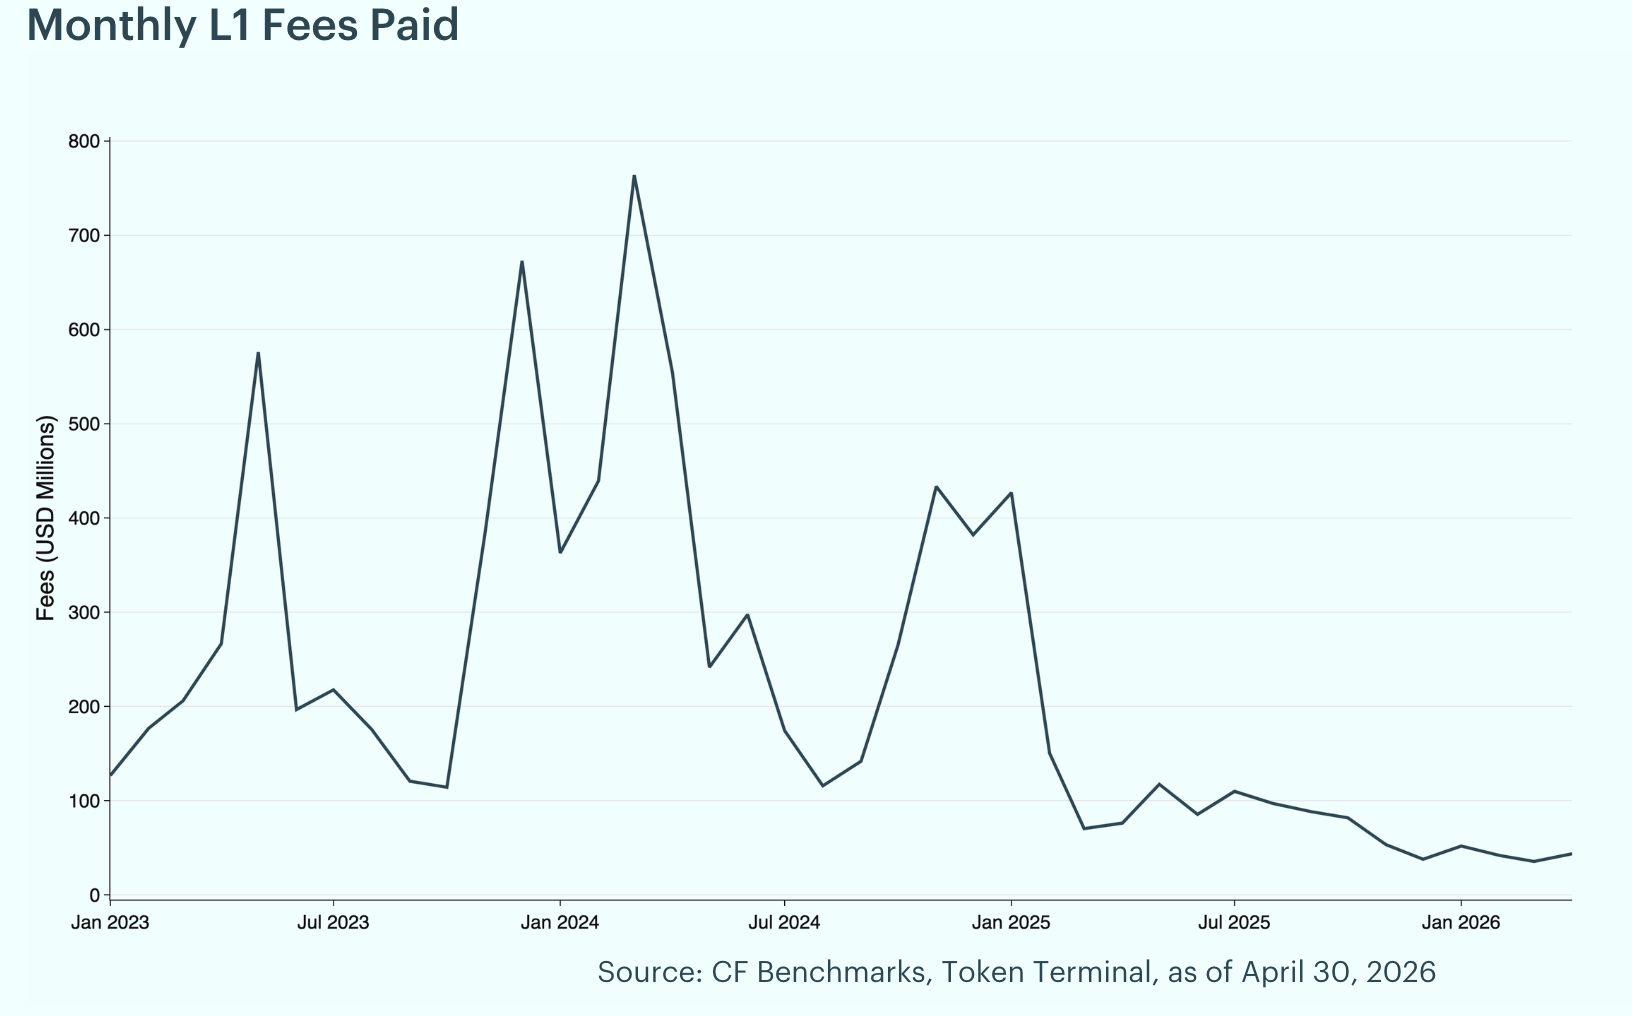
Layer-1 Fees Rebound, Ethereum Reclaims the Lead: Fees are the charges users pay to record transactions and data on a blockchain and act as a gauge for demand to use these networks. They tend to rise when there is an influx of new users on-chain and can fall when activity wanes or scaling upgrades reduce costs. Total L1 fees rebounded to $43.6M in April from $35.4M in March, a 23.0% month-over-month increase driven primarily by a sharp pickup in Ethereum activity. Ethereum led with $23.5M (53.9%), followed by Solana at $14.7M (33.7%) and Bitcoin at $5.1M (11.8%). Ethereum fees more than doubled month-over-month (+120.7%), reversing March's decline as the relief rally pulled volumes back on-chain. Solana fees, by contrast, declined 22.6% in a third consecutive month of softening generation.
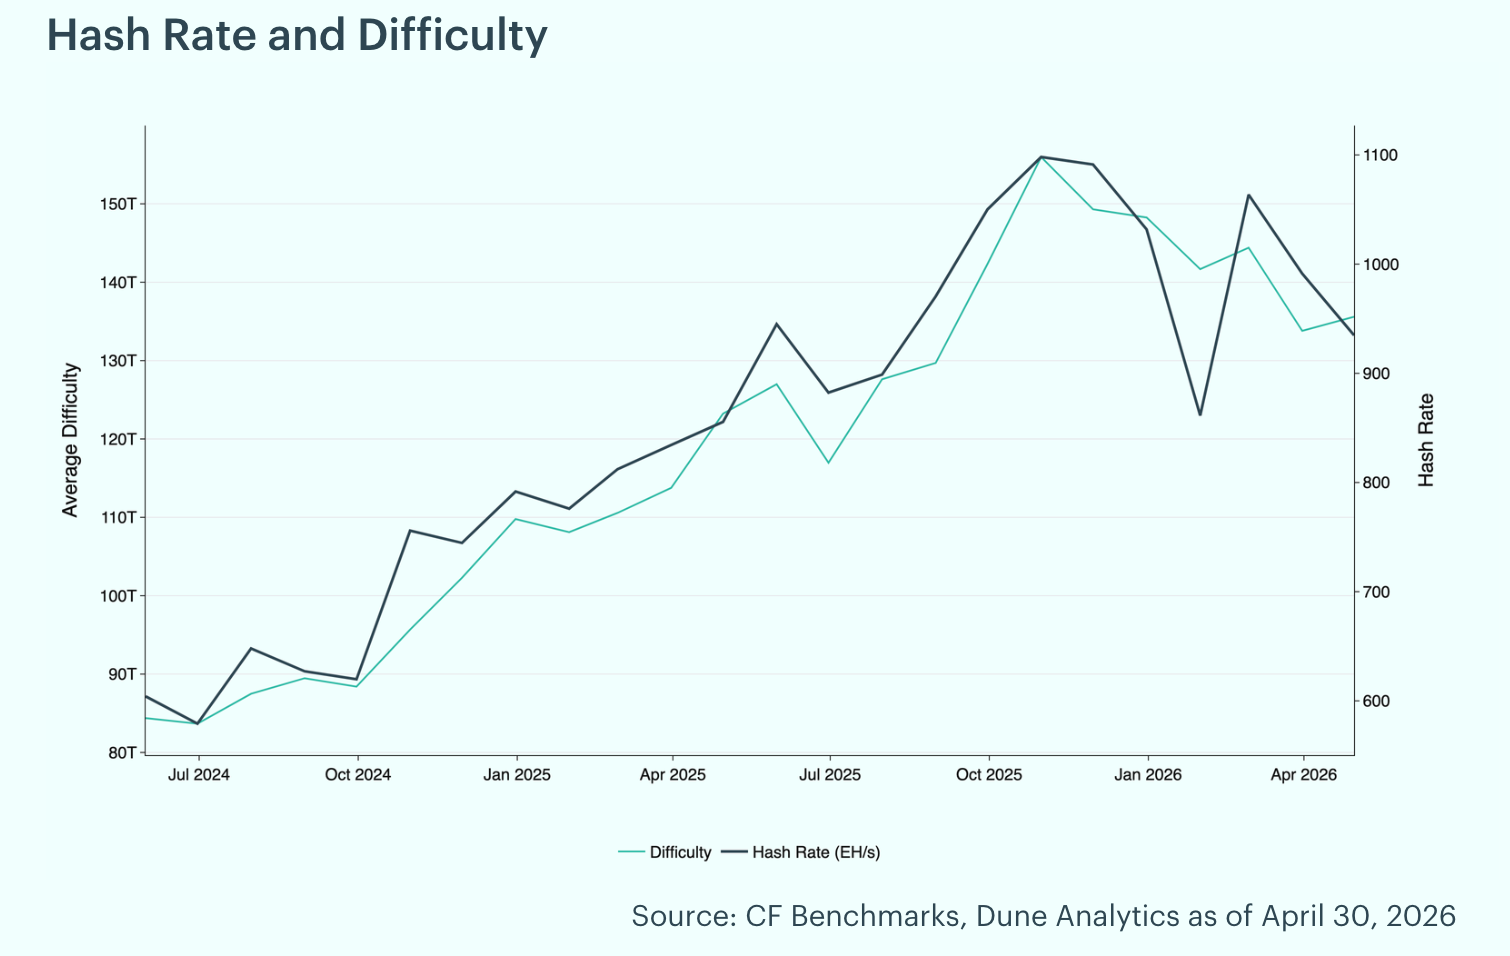
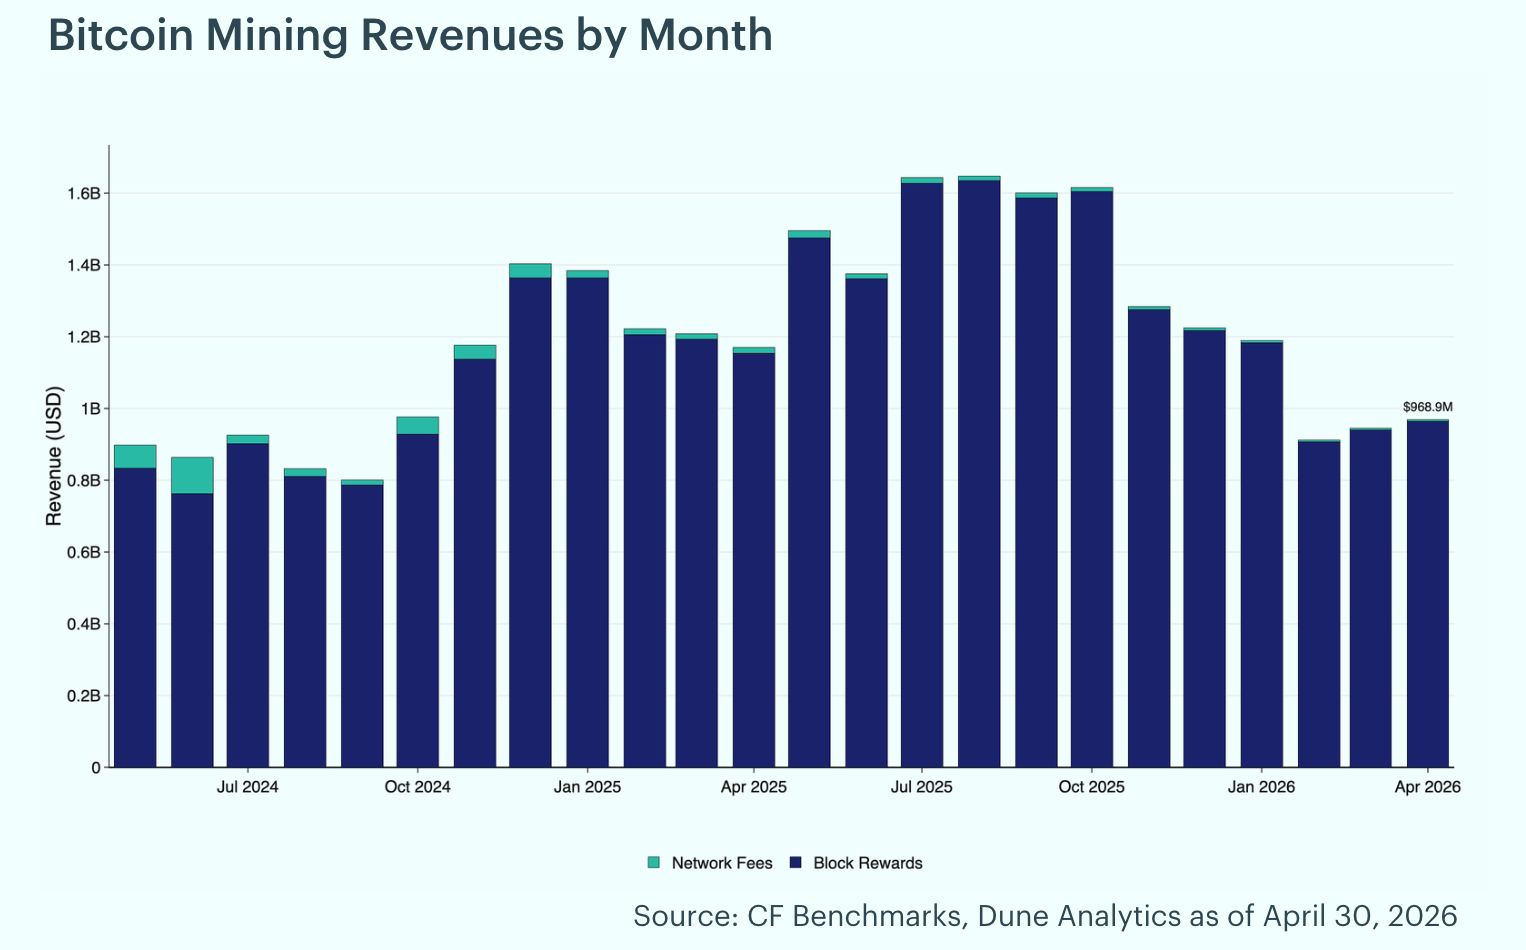
Hash Rate Retreats Further, Mining Revenue Edges Higher: Bitcoin's hash rate declined 5.7% in April, falling to 935 exahashes per second from 991 EH/s at March's end. Mining difficulty, which measures the computational effort required to mine a new block and adjusts to maintain consistent block times, increased modestly to 135.6T (+1.3%) as the network re-tightened on a lagged basis even as miner profitability remained pressured. Despite the lower hash rate, miners saw a 2.5% increase in revenue, with total mining revenue of $968.9 million. Of the total rewards earned during the month, 0.6% came from transaction fees, with block rewards totaling $963.4 million and fees contributing $5.4 million. The improvement was supported by higher Bitcoin prices throughout the month, more than offsetting the decline in network hash rate.
To read the complete report, kindly click on the provided link (or click here to view a PDF version). Additionally, please do not forget to subscribe to our latest news and research for the most relevant institutional insights on digital assets and the top digital assets by market cap.
The information contained within is for educational and informational purposes ONLY. It is not intended nor should it be considered an invitation or inducement to buy or sell any of the underlying instruments cited including but not limited to cryptoassets, financial instruments or any instruments that reference any index provided by CF Benchmarks Ltd. This communication is not intended to persuade or incite you to buy or sell security or securities noted within. Any commentary provided is the opinion of the author and should not be considered a personalised recommendation. Please contact your financial adviser or professional before making an investment decision.
Note: Some of the underlying instruments cited within this material may be restricted to certain customer categories in certain jurisdictions.
Non-Programmable Tokens Lead Rebound as Hedging Demand Softens
Digital assets rebounded broadly over the past week as a soft US jobs print pared rate-hike fear and ETF flows turned positive. Payments and settlement names led, breadth favored diversified exposure, implied volatility compressed, and Bitcoin front-end funding eased toward its term curve.

Mark Pilipczuk
Factor Friday - July 3, 2026
The broad market rebounded 5.22% this week after the prior week's selloff, but style factors mostly sat out the bounce. Value was the only factor in positive territory at 1.42%, extending its four-week gain to 3.67% while the Market remains down 2.24% over that span.
Mark Pilipczuk
Hawkish Fed & Geopolitical Fragility Broaden Drawdown
A hawkish Fed, a 4.2% CPI print, and fragile Iran diplomacy drove a broad, steep drawdown across digital assets in June. Every CF Benchmarks index fell, fund outflows hit a 2026 high near $4.1 billion, and investors stayed defensive as rate-cut hopes faded and the war premium lingered.
Mark Pilipczuk
By clicking Accept, you consent to CF Benchmarks's use of cookies.
Visit Cookie Settings to learn how CF Benchmarks uses cookies and to adjust your preferences.