
May 01, 2026
Factor Friday - May 1, 2026
Growth Snaps its Losing Streak as the Market Pulls Back to Close April
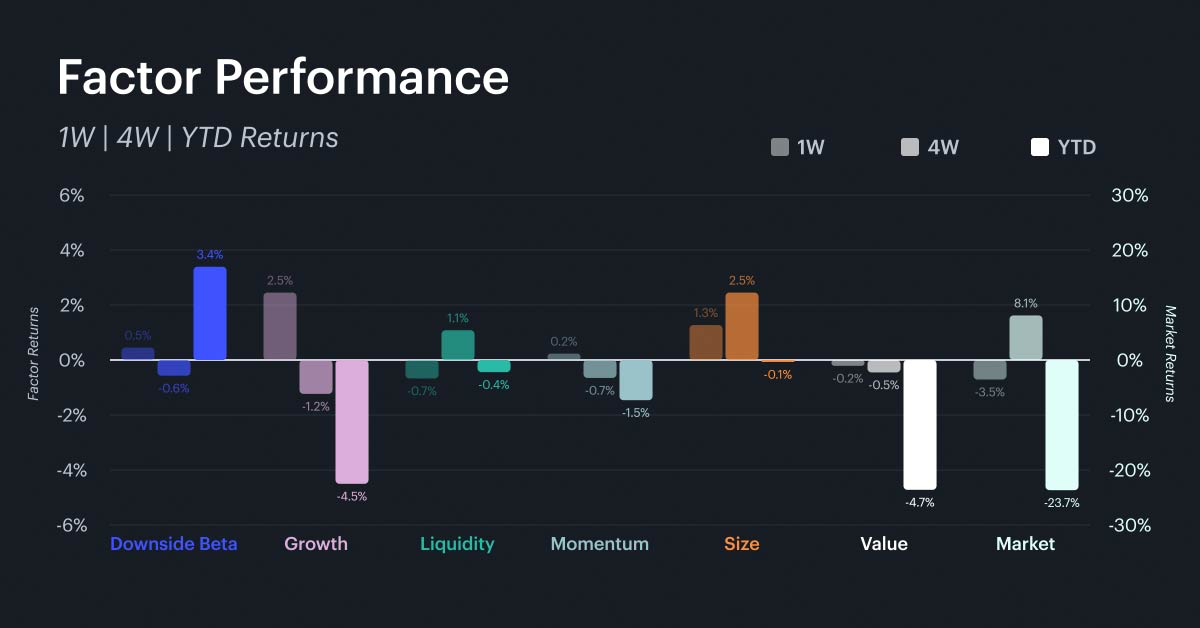
The market declined 3.5% on the week, trimming the month-to-date gain to +10.6% while the year-to-date decline sits at -23.7%. The headline this week is growth, which surged from the bottom of the rankings to the top at +2.5% on the week, snapping a multi-week losing streak that had dragged it to -4.5% year to date. Size continued its strong run at +1.3% on the week and +5.3% month to date, making it the second-best performer behind the broad market rally on the month. Downside beta posted a modest +0.5% weekly gain, while momentum (+0.2%), value (-0.2%), and liquidity (-0.7%) were largely flat. The divergence between size and growth on one hand and value and liquidity on the other suggests that the market currently favors small-cap, high-growth assets.
Rolling Factor Rankings and Rotation
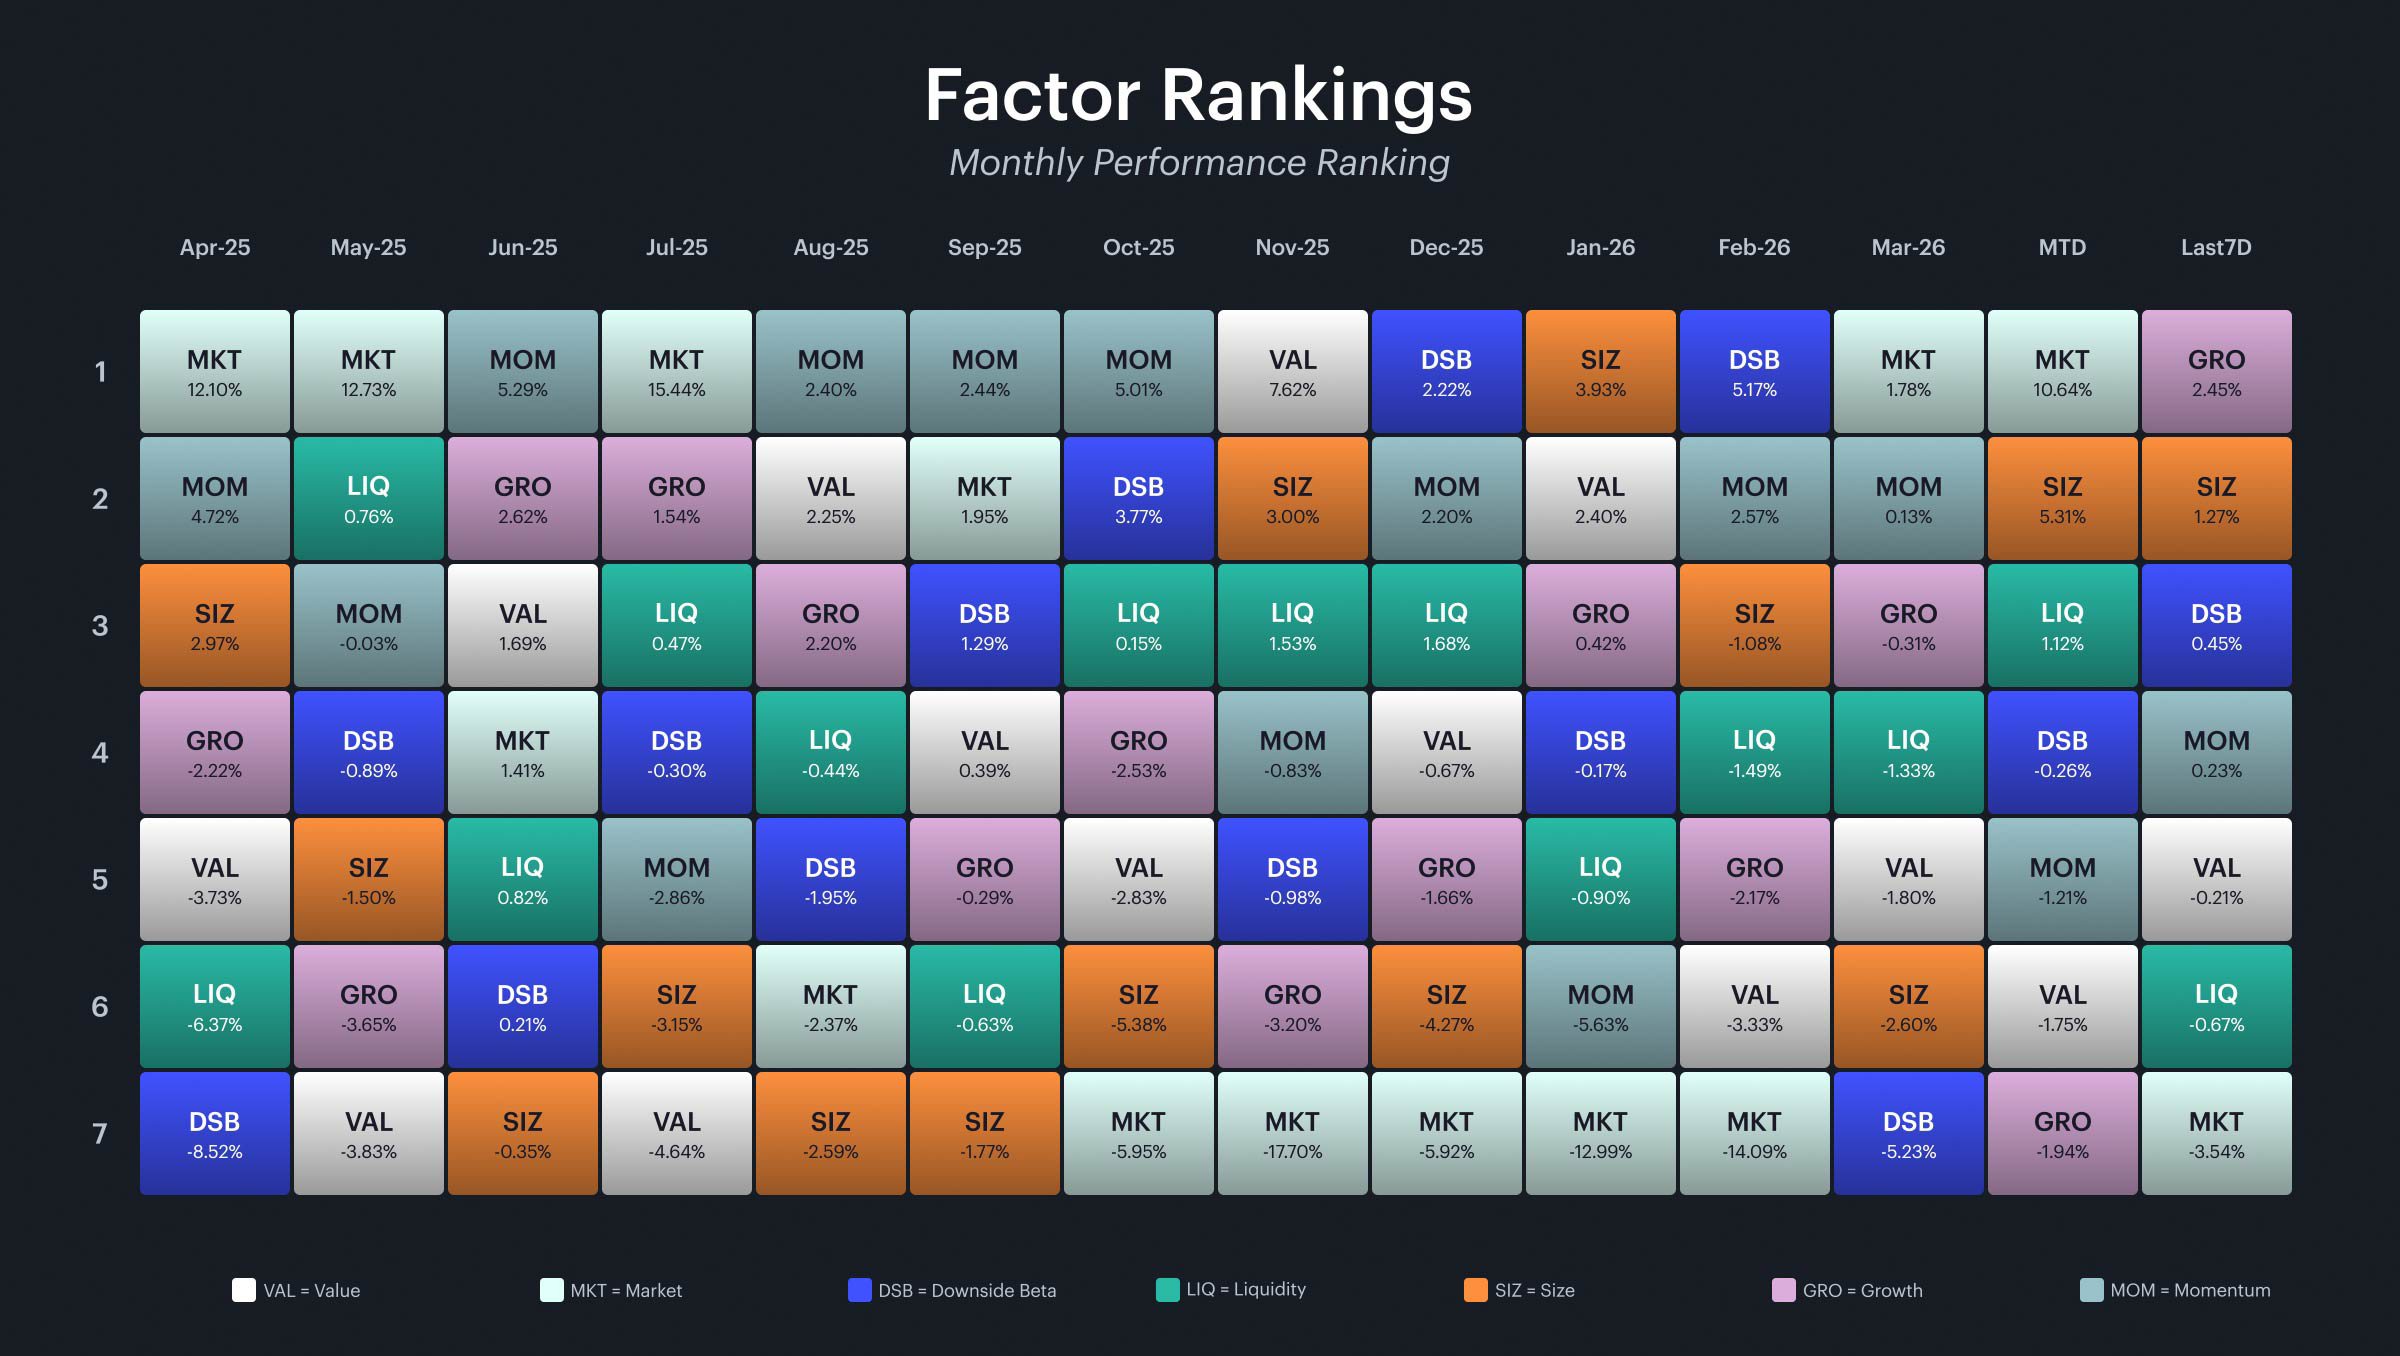
The quilt chart captures a notable shift in leadership this week. Growth jumped from last place to first at +2.5%, its strongest weekly showing in over a month. Size held second at +1.3%, reinforcing the small-cap theme that has dominated April. Downside beta, momentum, and value were tightly clustered near zero, signaling a pause in their directional trends. Looking at the monthly view, the market factor leads at +10.6%, followed by size at +5.3%. The remaining factors are clustered between -0.3% and -1.9%, with growth bringing up the rear at -1.9% on the month despite its weekly reversal. This dynamic - a strong week set against a weak month - is worth watching. If growth can sustain this momentum into May, it would mark a meaningful regime shift away from the size-dominated, growth-lagging pattern that has defined Q2 so far.
Market and Key Factor Betas
Market Beta
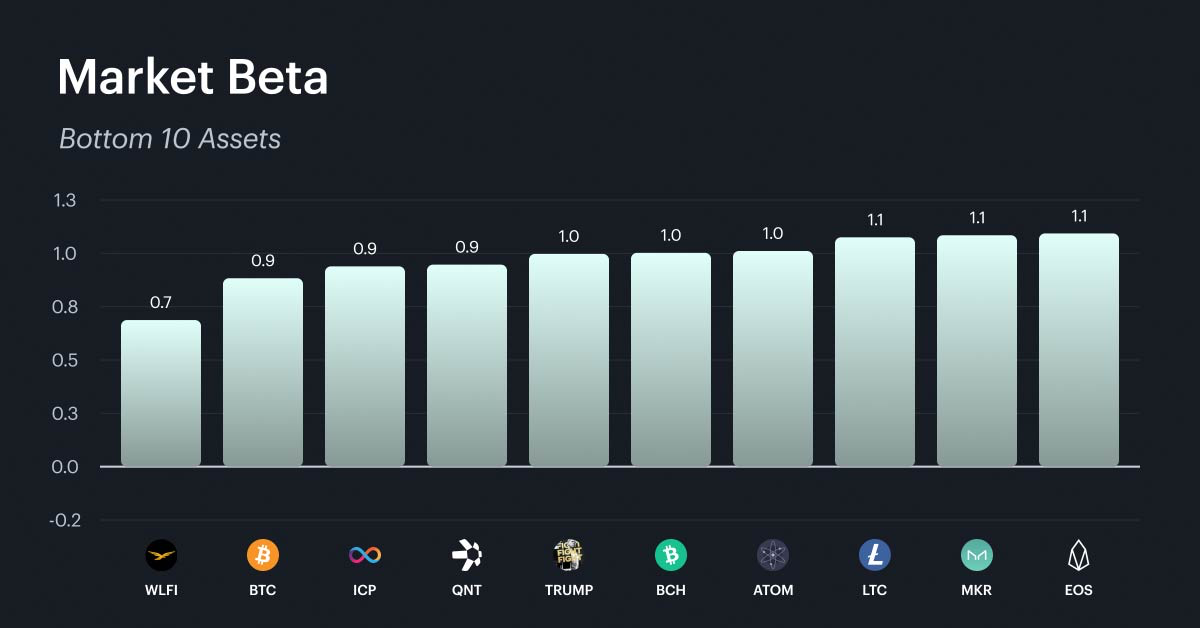
The market beta distribution remains consistent. The high-beta cohort is populated by mid-cap DeFi protocols, meme tokens, layer-2 scaling solutions, and gaming infrastructure, with betas ranging from roughly 1.5 to 1.6. These are the names that amplify broad market moves in both directions. The low-beta group continues to be anchored by large-cap, high-liquidity assets like BTC, along with a mix of established layer-1 networks and niche governance tokens. These assets consistently dampen market swings and serve as relative safe havens during drawdowns like this week's -3.5% pullback.

Size
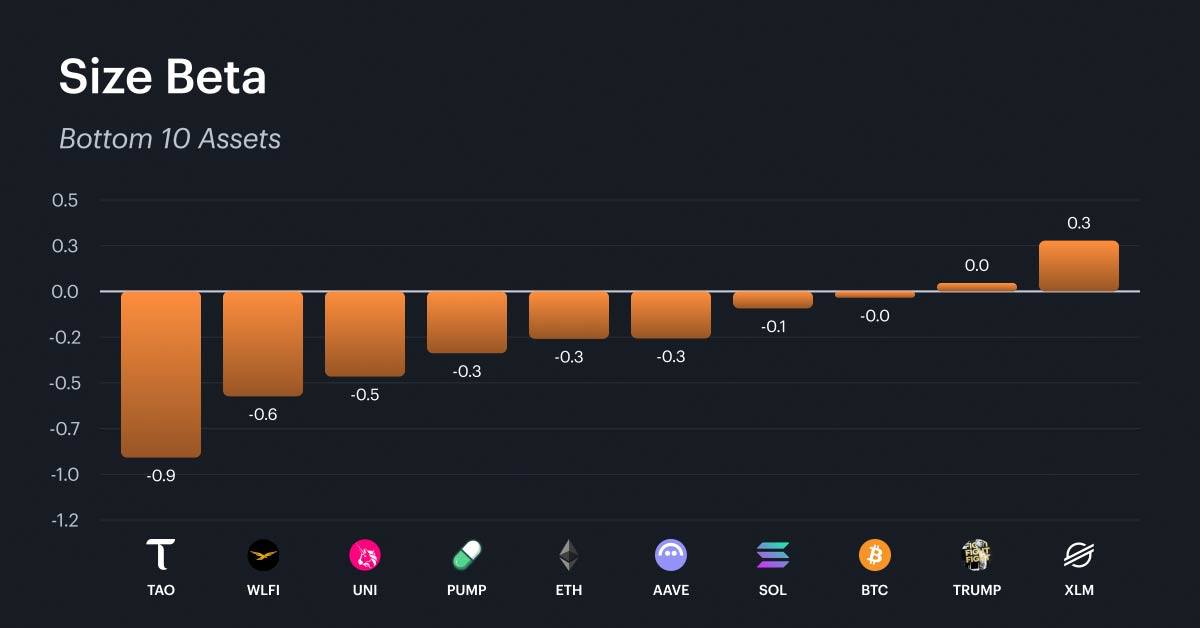
Size remains one of the best-performing factors this month at +5.3%, and the beta distribution tells the story of why. The high size-beta cohort is dominated by meme coins, AI and data infrastructure tokens, and gaming-adjacent assets - the types of names that carry smaller market capitalizations and thinner liquidity profiles. These tokens tend to outperform when the market is favoring risk-on positioning in smaller names. On the other side, the low size-beta group is made up of large-cap DeFi blue chips, established layer-1 networks, and governance tokens. The concentration of mega-caps like BTC and ETH at the bottom, with meme and micro-cap tokens at the top, confirms that the size factor is cleanly capturing the large-vs-small divide. For investors, the continued strength in the size factor suggests that capital is flowing down the market cap spectrum, a pattern that historically accelerates in the later stages of rallies.

Growth
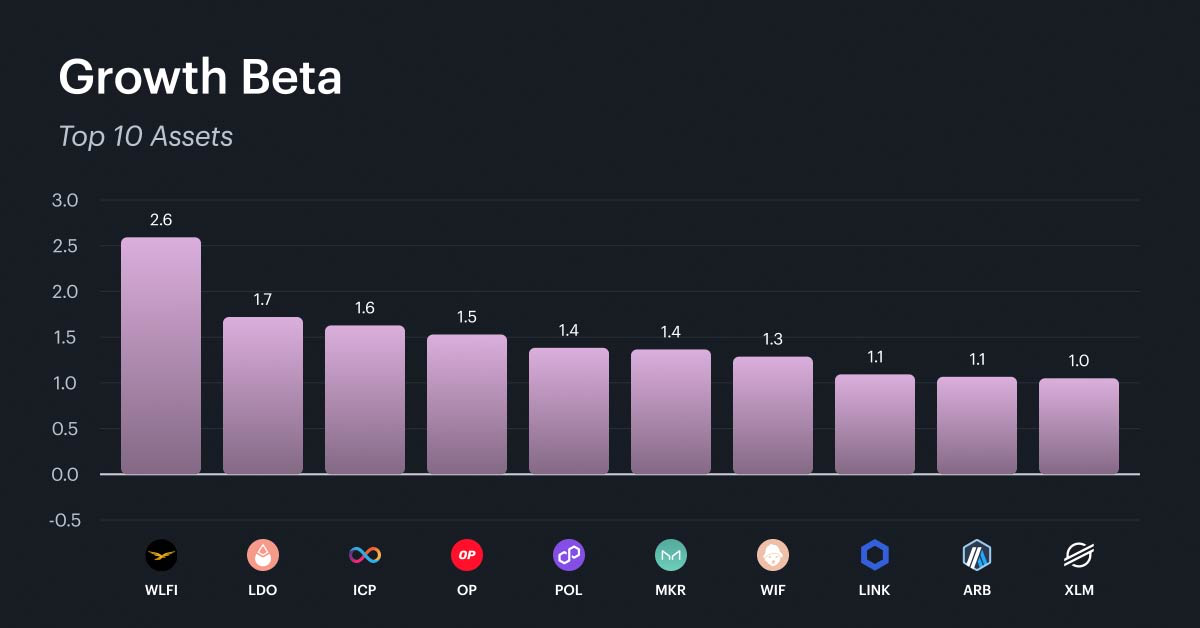
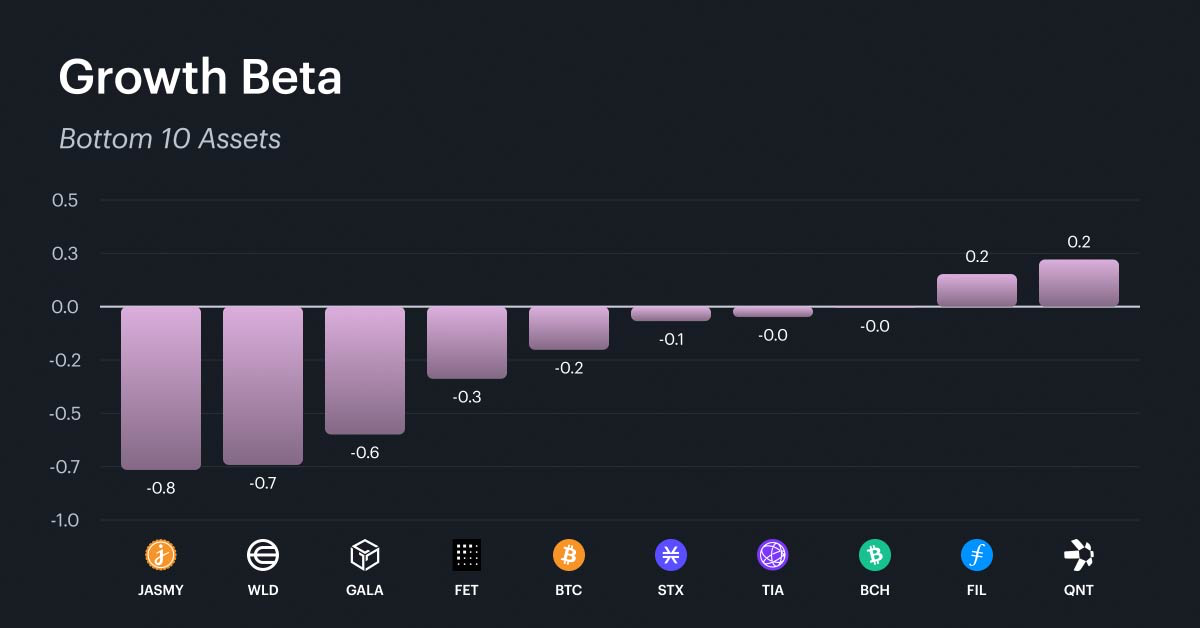
Growth's reversal from the worst performer to the best this week makes its beta composition particularly relevant. The high growth-beta cohort is concentrated in governance tokens, layer-2 scaling solutions, DeFi infrastructure, and cross-chain interoperability protocols. These are names tied to expanding network activity and protocol adoption - the fundamental drivers that the growth factor is designed to capture. The low growth-beta group features IoT and data-focused tokens, AI infrastructure, gaming, and established store-of-value assets. The contrast is instructive: the tokens that benefited most from growth's weekly surge are those with improving on-chain fundamentals, while the laggards tend to be either speculative or anchored to narratives that have cooled. Growth's +2.5% weekly gain against a -4.5% year-to-date backdrop does not yet signal a sustained reversal, but the composition of its high-beta names points to a market that may be starting to reward fundamental adoption metrics over pure price momentum.
What Factors are Driving Markets
The Sectors category index returned +8.9% over the trailing 30 days, while cumulative factor contributions totaled +3.6%. The gap of roughly 5.3 percentage points indicates that a significant portion of Sectors returns came from sources outside the factor model. Size was the dominant factor contributor at +4.3%, consistent with the small-cap outperformance theme. Growth was the largest drag at -1.3%, though its weekly reversal could narrow this contribution gap if sustained. Liquidity added a modest +0.4%, while the remaining factors were near zero.
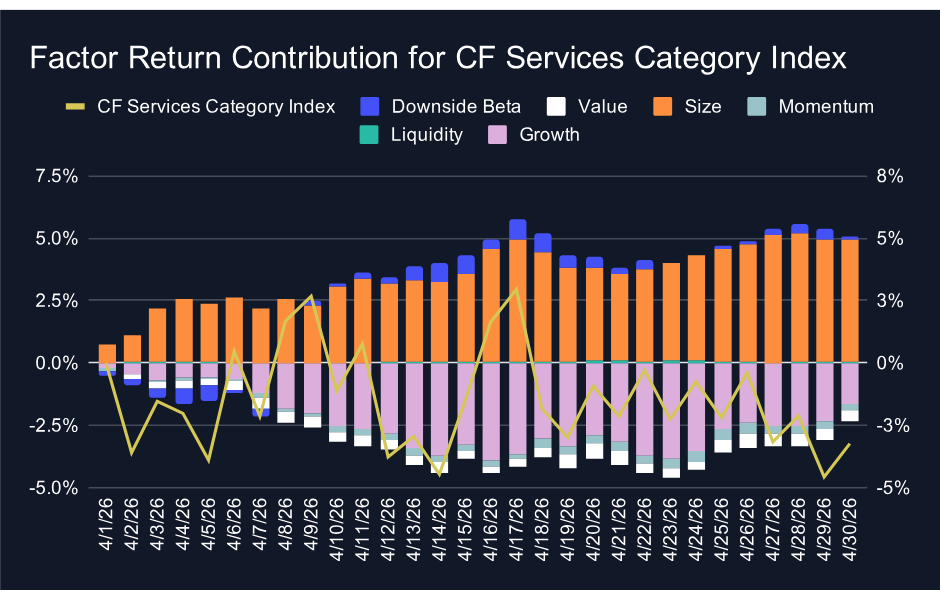
The Services category presents an interesting divergence. Cumulative factor contributions came in at +2.7%, while the index returned -3.2% over the trailing 30 days. This means factors exceeded the index by approximately 5.9 percentage points - a rare outcome where the factor model outperforms the underlying index. Size again led the way at +4.9%, but growth was a significant headwind at -1.7%. The negative index return despite positive factor contributions suggests that Services-specific headwinds are weighing on the category in ways the factor model does not capture.
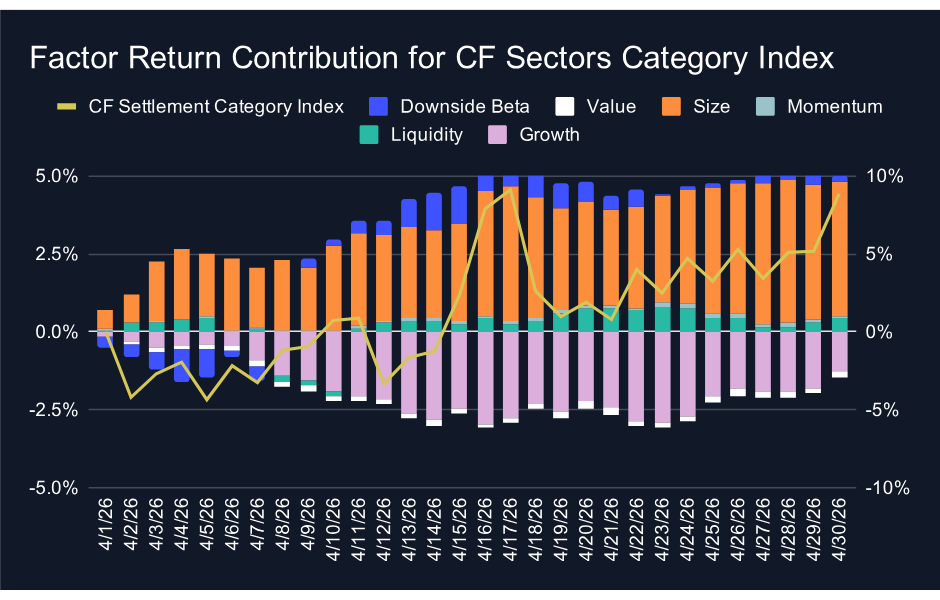
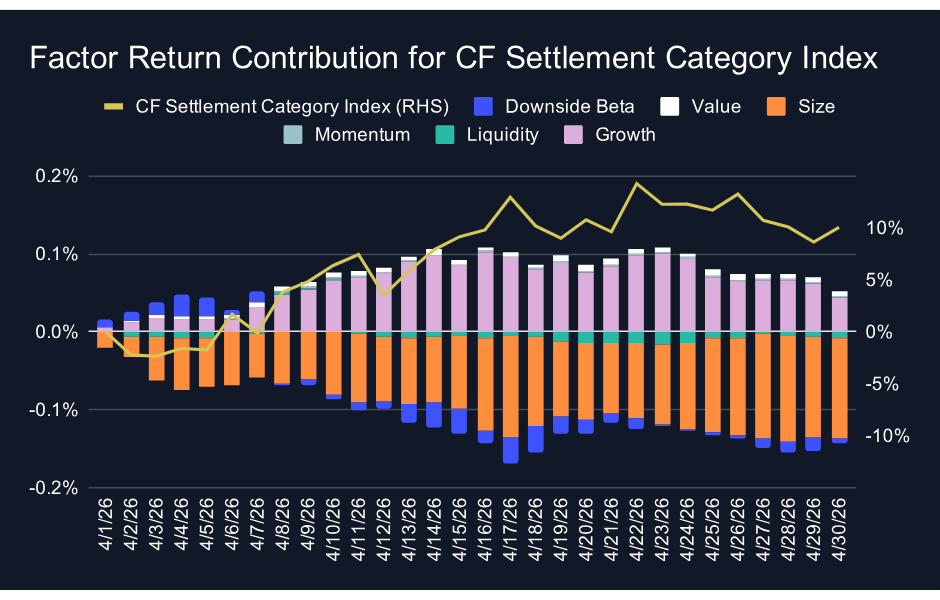
The Settlement category shows the widest gap between factors and index this week. The index returned +10.0% over the trailing 30 days, while cumulative factor contributions were essentially flat at -0.1%. The 10.1 percentage point gap is the largest across the three categories and suggests that Settlement's returns are almost entirely driven by idiosyncratic or market-level forces rather than systematic factor exposure. For investors watching factor-based strategies in the Settlement space, this disconnect highlights the limits of factor models for a category dominated by a small number of large, structurally unique assets.
Appendix: CF Factor Methodology
Market Factor
The market factor captures the broad, systematic risk that permeates the digital asset ecosystem. It reflects aggregate influences such as macroeconomic conditions, investor sentiment, and overall market volatility. As such, this factor is defined by the daily returns of the CF Broad Cap (Free Float Market Cap Weight) Index, offering a comprehensive and capitalization-weighted representation of the asset class.
Size Factor
The size factor captures the return differential associated with asset scale, reflecting the hypothesis that smaller-cap digital assets tend to outperform their larger-cap counterparts. This effect is understood to compensate for elevated operational and financial risks while exploiting potential market inefficiencies. In this framework, the size factor is defined by each asset’s fully diluted market capitalization. The value is sign-inverted so that higher z-scores are assigned to smaller assets and vice-versa.
Value Factor
The value factor reflects a protocol’s ability to generate economic output relative to its capital base and market valuation, combining measures of both efficiency and user engagement. It is constructed as the average z-score of two key ratios: transaction fees relative to total value locked (Fees/TVL) and daily active users relative to market capitalization (DAU/MCap). This composite metric captures how productively a protocol utilizes its resources while also serving as a proxy for user-driven demand. A higher combined score indicates efficient resource utilization and strong user engagement.
Momentum Factor
The momentum factor captures short-term price persistence by identifying assets that have recently exhibited strong performance. It is computed as the average z-score of two metrics: the 2 weeks cumulative performance and the 2 weeks risk-adjusted cumulative performance. This approach aligns with established findings in traditional financial literature and demonstrates empirical relevance in digital assets, where price trends tend to exhibit momentum over short horizons.
Growth Factor
The growth factor captures the expansion of a protocol’s network activity and user adoption. In the context of digital assets, it reflects metrics such as fee generation and user engagement, which serve as indicators of increased platform utilization and operational scale. The factor is defined as the average z-score of 30-day fee growth and 30-day weekly active user growth, thereby identifying assets exhibiting consistent and measurable increases in underlying network usage.
Downside Beta
The downside beta factor captures an asset’s sensitivity to adverse market conditions by isolating its behavior during periods of negative market returns. Empirical evidence shows that assets with lower downside beta tend to outperform their higher-beta counterparts over the long-term, due to their reduced participation in market drawdowns and more stable return profiles during periods of elevated volatility. As such, it is estimated through a regression of the asset’s daily returns over the most recent four-week period against market returns observed exclusively during negative sessions. The resulting value is sign-inverted to ensure that assets with lower downside exposure are assigned higher z-scores.
Liquidity Factor
The liquidity factor captures the ease with which a digital asset can be traded without significantly impacting its price. Empirical evidence shows that illiquid assets tend to command a higher risk premium than their more liquid counterparts, serving as compensation for trading friction and price volatility. To quantify this, the factor is measured using token turnover, defined as trading volume as a percentage of circulating supply. The value is sign-inverted such that higher z-scores are assigned to less liquid assets.
For further detail, view the CF Factors Methodology Document, the CF Factor Data Suite, and Our paper “A Factor Model for Digital Assets” in Springer Nature’s Mathematical Research for Blockchain Economy
The information contained within is for educational and informational purposes ONLY. It is not intended nor should it be considered an invitation or inducement to buy or sell any of the underlying instruments cited including but not limited to cryptoassets, financial instruments or any instruments that reference any index provided by CF Benchmarks Ltd. This communication is not intended to persuade or incite you to buy or sell security or securities noted within. Any commentary provided is the opinion of the author and should not be considered a personalised recommendation. Please contact your financial adviser or professional before making an investment decision.
Note: Some of the underlying instruments cited within this material may be restricted to certain customer categories in certain jurisdictions.
Changes to the Token Market Price Benchmarks Series - Market Prices – 21 July 2026
The Administrator has confirmed changes to the Token Market Price Family for the period 14 July 2026 to 21 July 2026.

CF Benchmarks
Softer CPI Reprices July Hike Risk & Lifts Digital Assets
Digital assets extended their recovery over the past week as cooler US inflation prints repriced Fed expectations; the bid was broad across the large cap indices, growth factor leadership returned, stablecoin funding repriced lower, and stress stayed isolated in names hit by token-specific news.
Mark Pilipczuk
Notice of the Demising of CF Dai-Dollar Settlement Price and Spot Rate
The Administrator announces that it will demise the CF Dai-Dollar Settlement Price (DAIUSD_RR) and CF Dai-Dollar Spot Rate (DAIUSD_RTI) which are members of the CF Digital Asset Index Family.
CF Benchmarks
By clicking Accept, you consent to CF Benchmarks's use of cookies.
Visit Cookie Settings to learn how CF Benchmarks uses cookies and to adjust your preferences.