
Mar 27, 2026
Factor Friday - March 27, 2026
Momentum Leads as the Market Sells Off
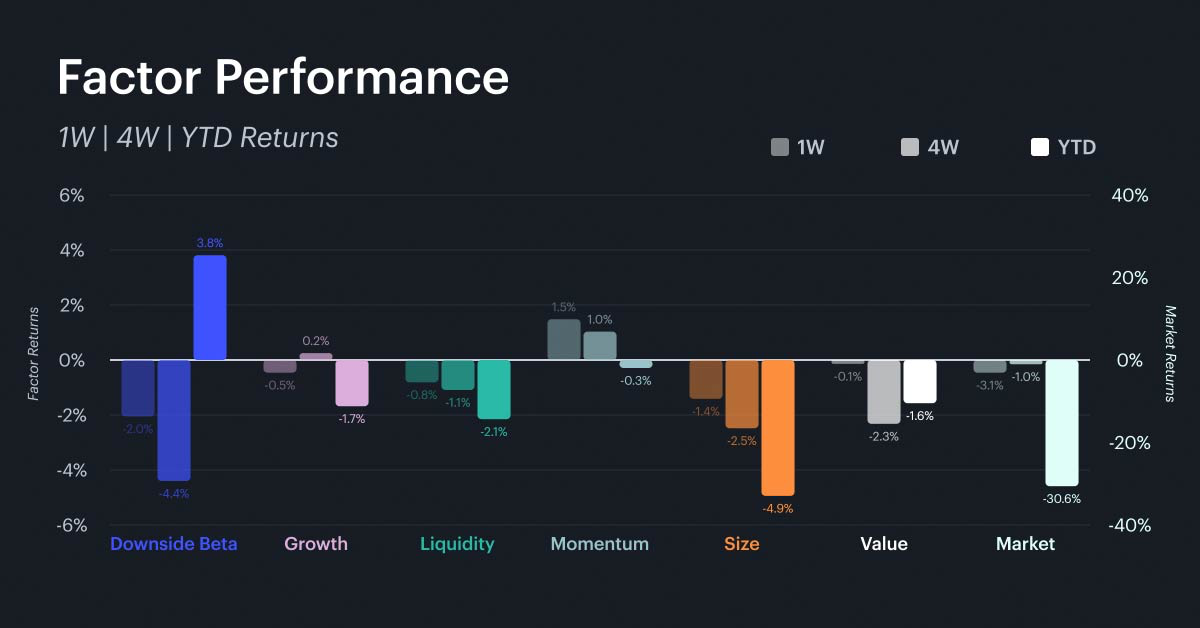
The market declined 3.1% on the week, giving back a portion of the rally that had narrowed the year-to-date drawdown over recent weeks. The year-to-date loss now stands at 30.6%. The best performer this week is momentum, which topped the weekly factor rankings for the first time this year at +1.5%, a meaningful gap over the others. Value held up relatively well at -0.1% on the week, while growth posted a modest decline of 0.5%. Downside beta fell 2.1% on the week and has now dropped 4.4% over four weeks, though it still holds the year-to-date lead at +3.8%. The market factor posted the steepest decline of the group at -3.1% on the week, extending the broad sell-off that pulled the year-to-date return to -30.6%. The rotation away from downside beta that began five weeks ago has now extended to momentum, completing a full circuit through the factor universe. This breadth of rotation is notable. Rather than a single factor reasserting dominance, each week has seen a different leader emerge. For investors, momentum's arrival at the top signals that recent winners are beginning to attract incremental capital, a dynamic that can be self-reinforcing in the short term.
Rolling Factor Rankings and Rotation
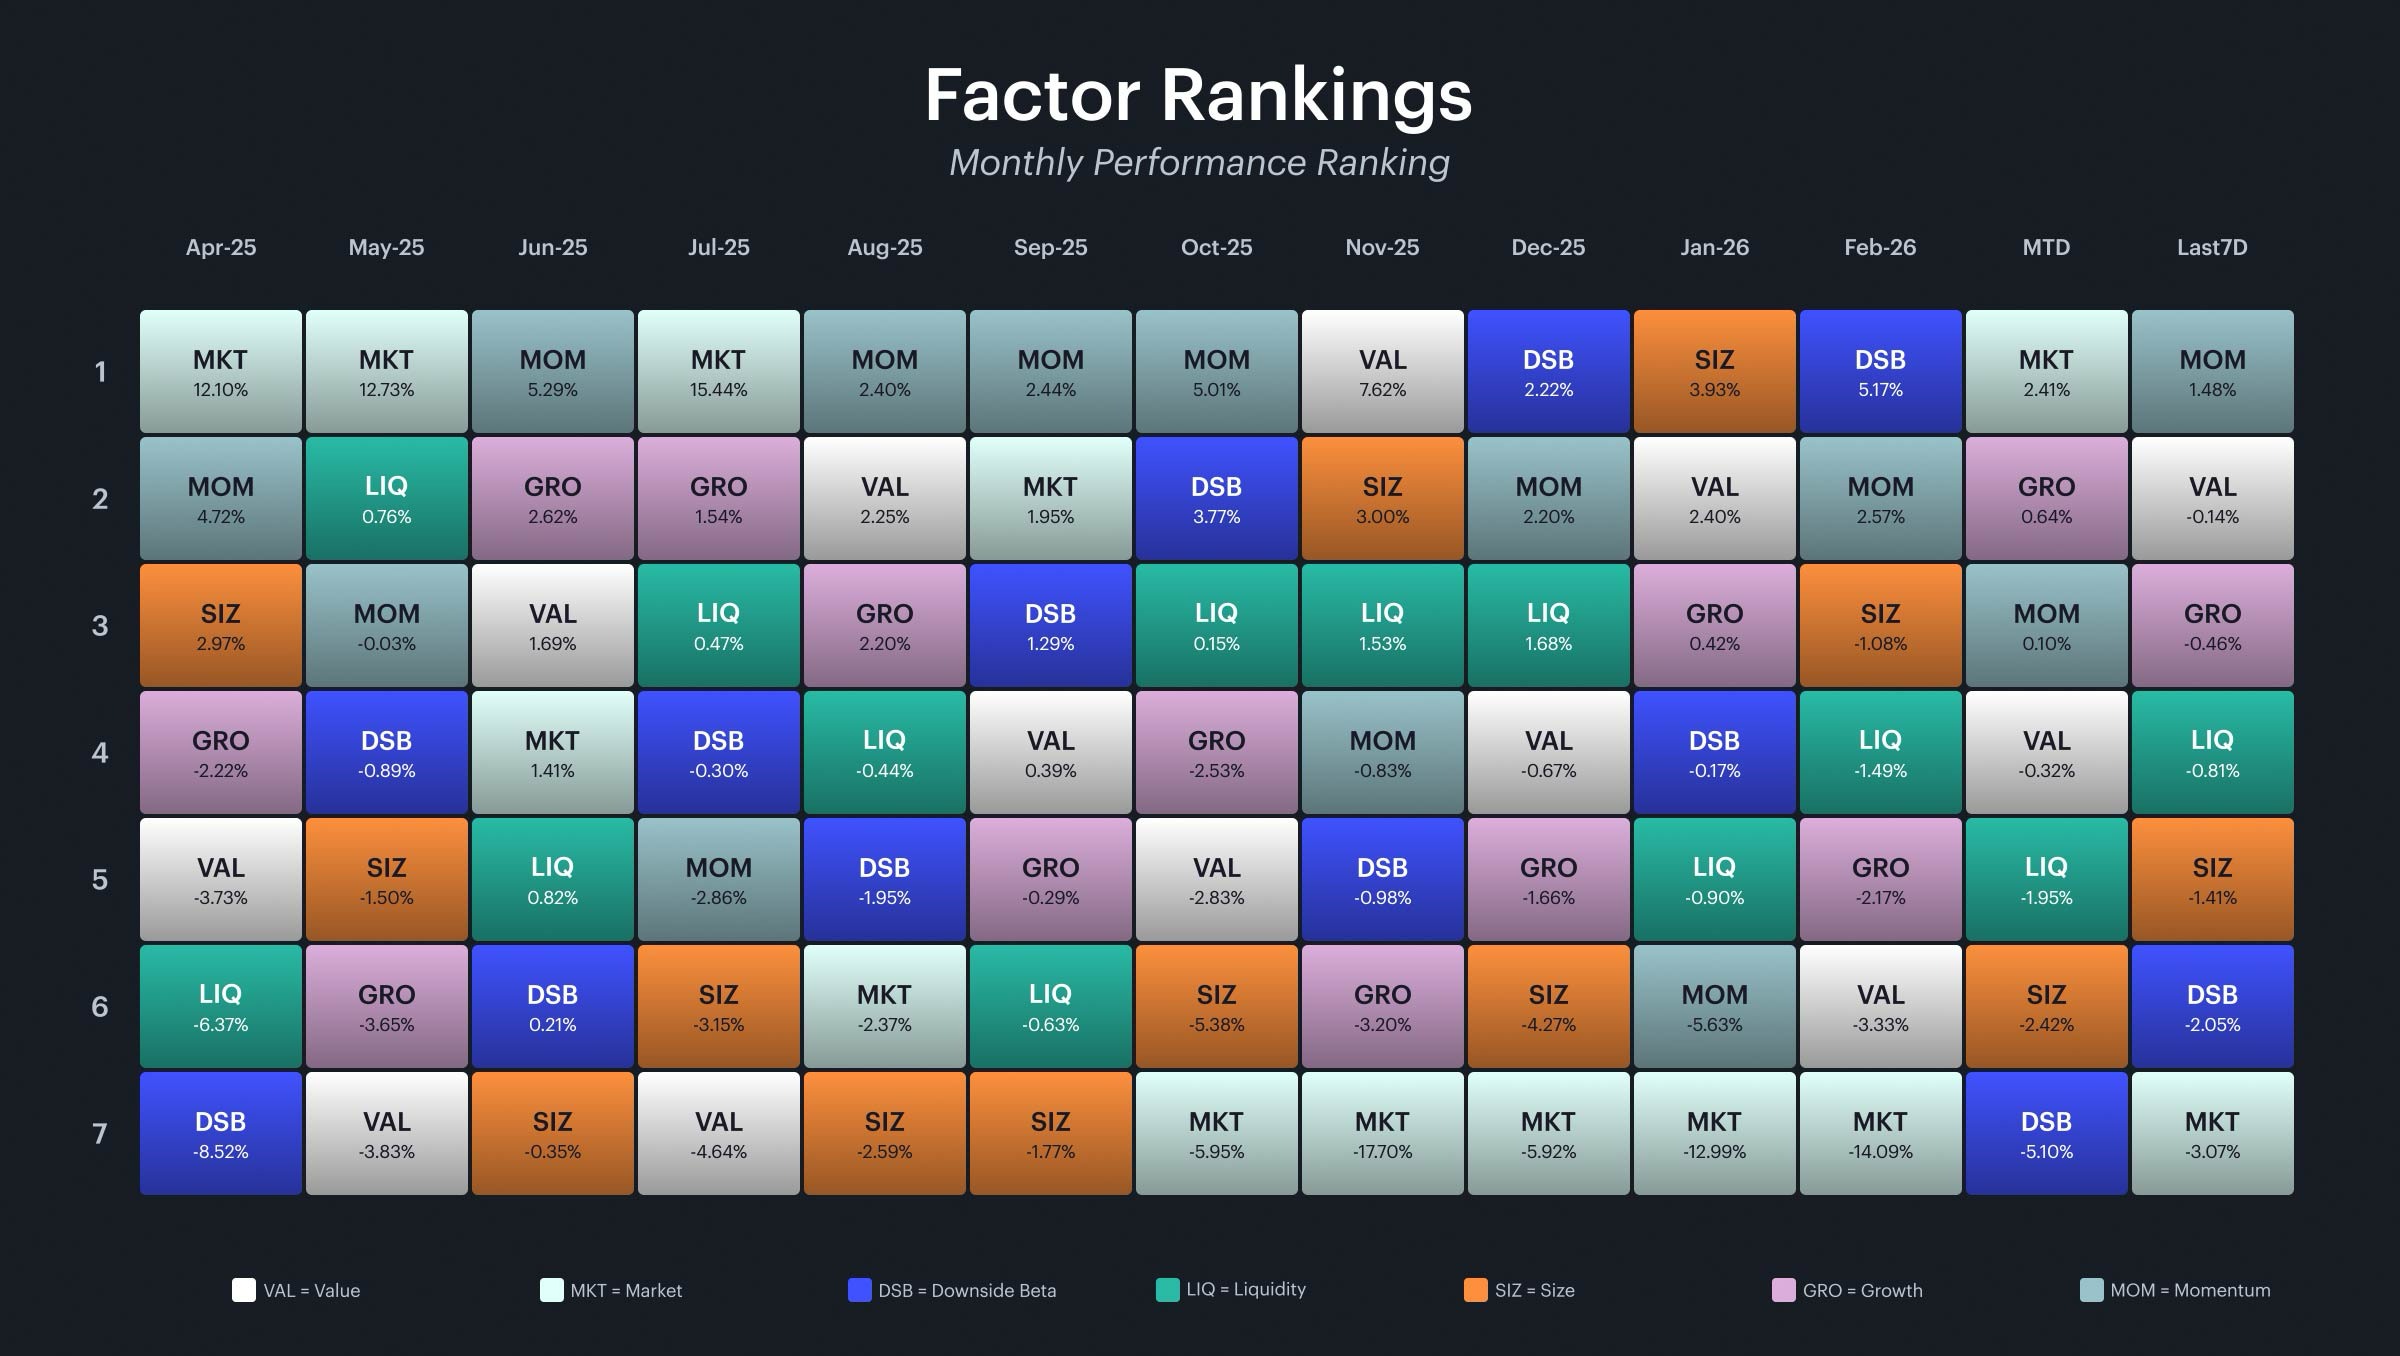
The quilt chart showcases the factor rotation. Momentum sits at the top of the weekly rankings at +1.5%, with value in second at -0.1% and growth in third at -0.5%. On a month-to-date basis, the market factor leads at +2.4%, followed by growth at +0.6%, with momentum in third at +0.1%. The progression over the past five weeks has been remarkably orderly: downside beta led in late February, value and growth took over in early March, liquidity surged to the top last week, and now momentum has claimed the weekly lead. Each transition has coincided with a different part of the market rotating into favor. The quilt also shows downside beta falling to last place in both the monthly rankings at -5.1% and second-to-last on the week at -2.1%, a stark contrast to its dominance through February. For investors, the orderly week-to-week rotation is a healthier signal than a single factor dominating repeatedly, but the market's inability to sustain gains suggests that the recovery is still fragile. The factor rotation is broadening, but it has not yet translated into a sustained directional move higher.
Market and Key Factor Betas
Market Beta
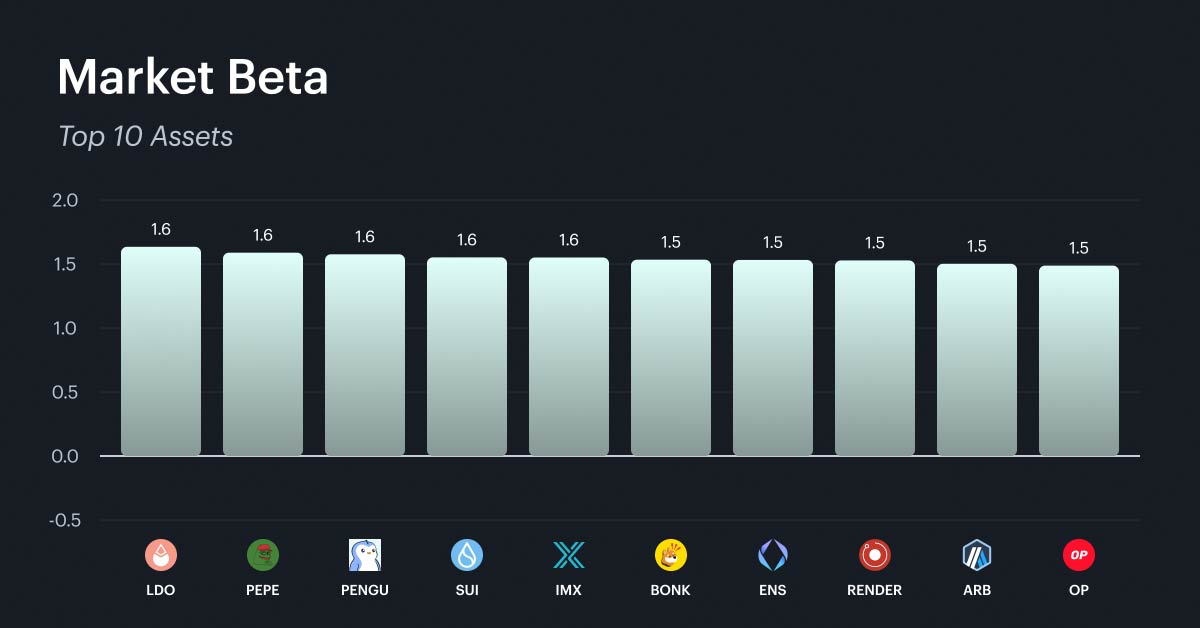
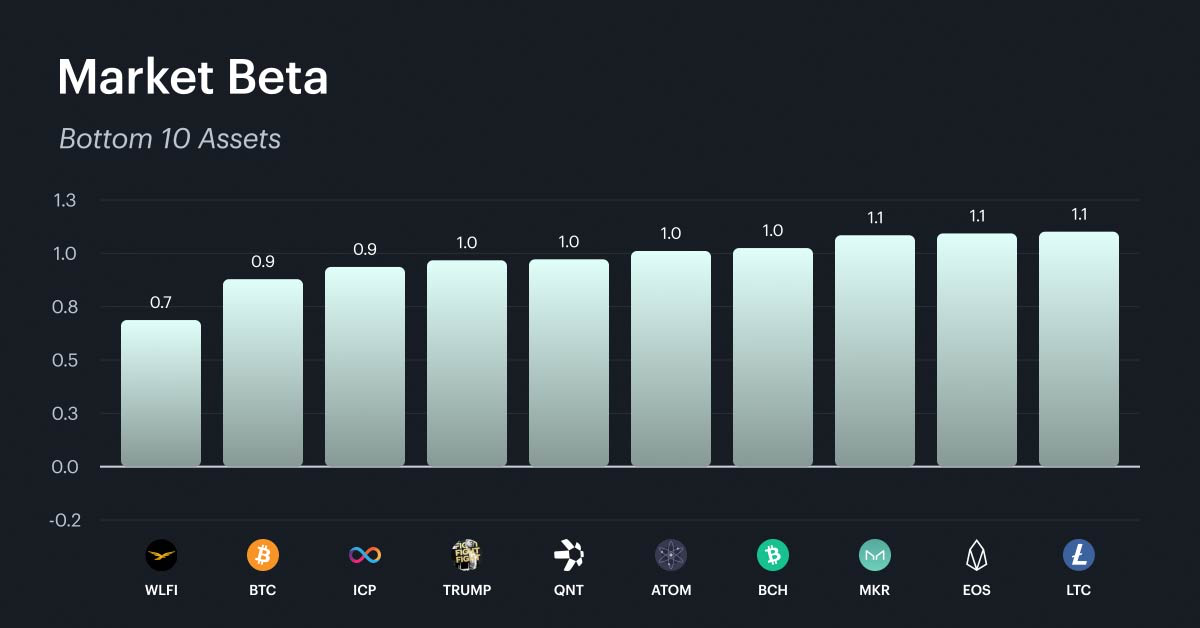
The market beta rankings remain stable for the fifth consecutive week. The high-beta cohort is unchanged: meme coins, newer layer-1 and layer-2 platforms, and DeFi infrastructure tokens continue to cluster between 1.5 and 1.6. The low-beta end is similarly persistent, anchored by WLFI at 0.7, BTC at 0.9, ICP and TRUMP at 0.9, and a group of established infrastructure-layer and store-of-value protocols at or near 1.0. The continued stability of these rankings through five weeks of dramatic factor rotation reinforces an important point: the underlying market risk profiles of individual assets have not changed even as factor leadership has shifted completely. High-beta names continue to show weakness in a down market, and this week's 3.1% market decline hit them hardest. Investors who added beta during the rally should be prepared for amplified drawdowns if selling continues, while those still positioned in lower-beta assets have seen their defensive positioning outperform during the pullback.
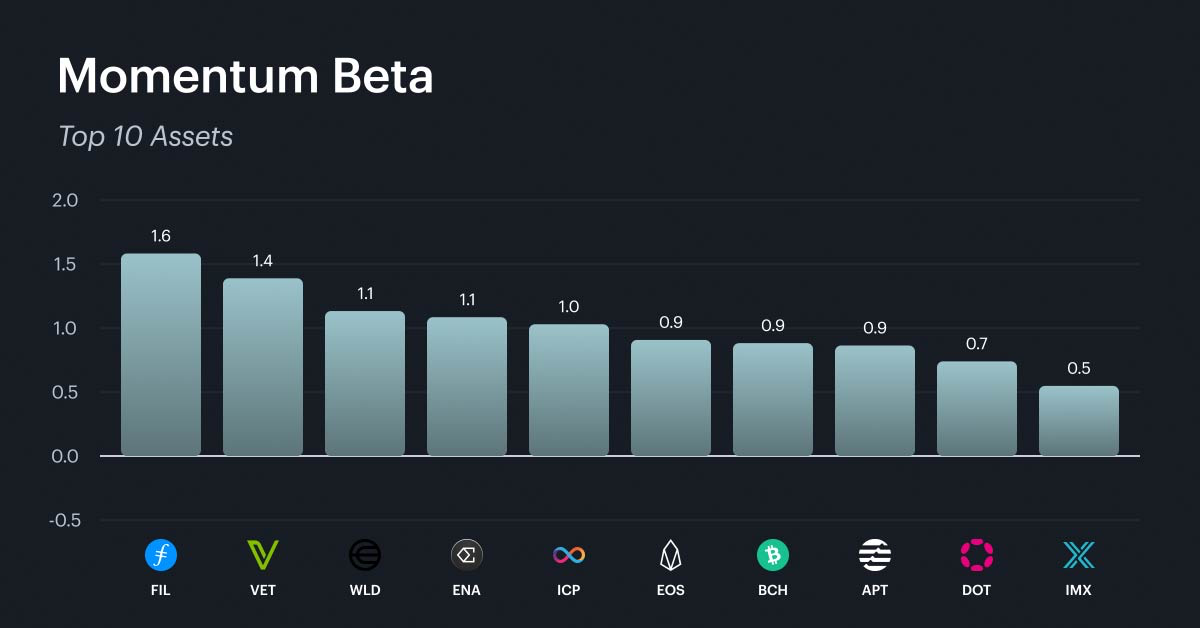
Momentum
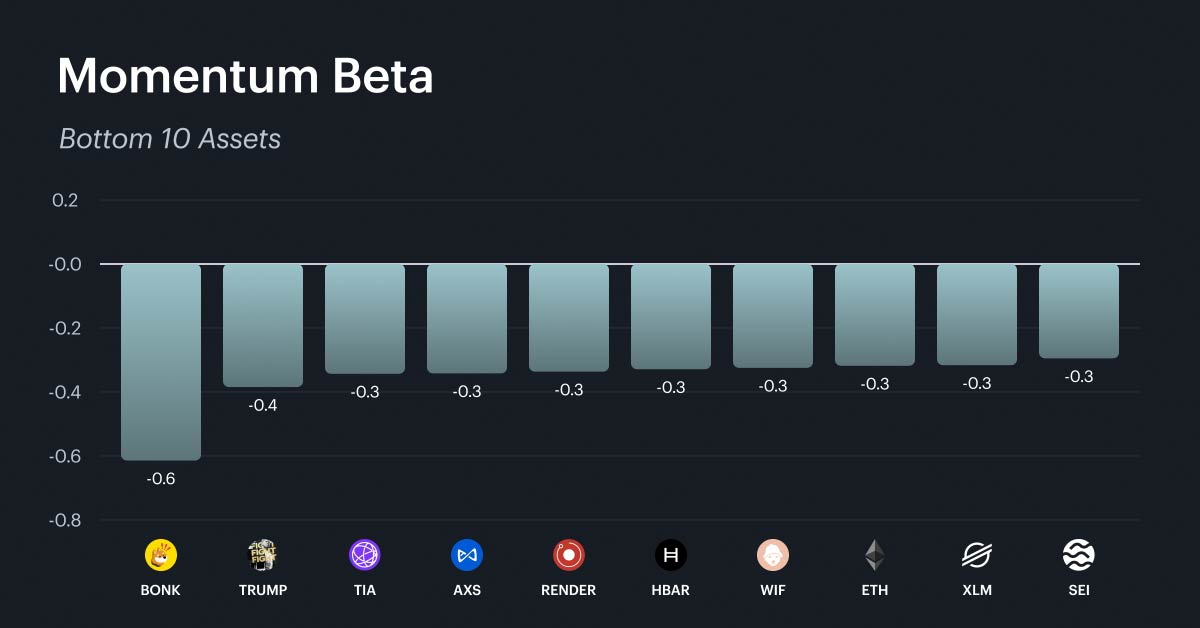
With momentum claiming the top spot in the weekly factor rankings, this factor's beta distribution is the most relevant to examine this week. The momentum factor captures short-term price persistence, identifying assets that have recently exhibited strong performance on both an absolute and risk-adjusted basis. The top assets by momentum beta are dominated by mid-cap infrastructure protocols, established layer-1 platforms, and select DeFi tokens. The bottom 10 tells an equally important story. Meme coins, speculative DeFi names, and some established large-caps populate this list, meaning they face headwinds in a momentum-driven environment. For investors, the momentum factor's recent dominance suggests that chasing recent winners may work in the near term. It is important to remember that momentum tends to reverse sharply when market direction changes. Sizing positions conservatively and maintaining strict risk limits is critical when relying on momentum as a factor tilt.
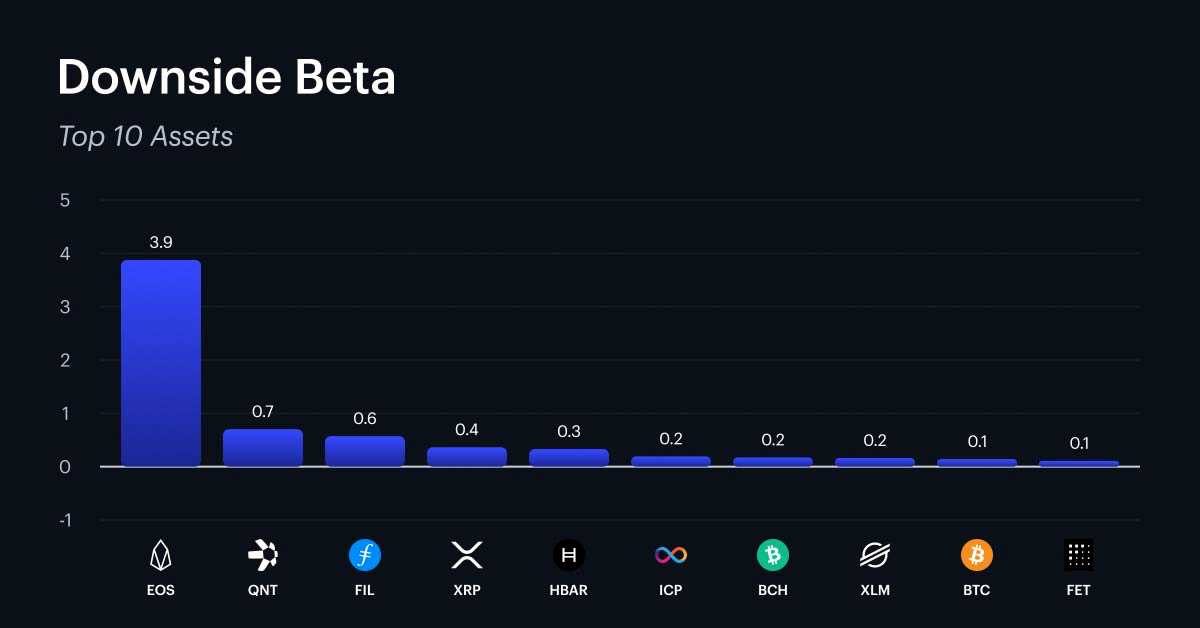
Downside Beta
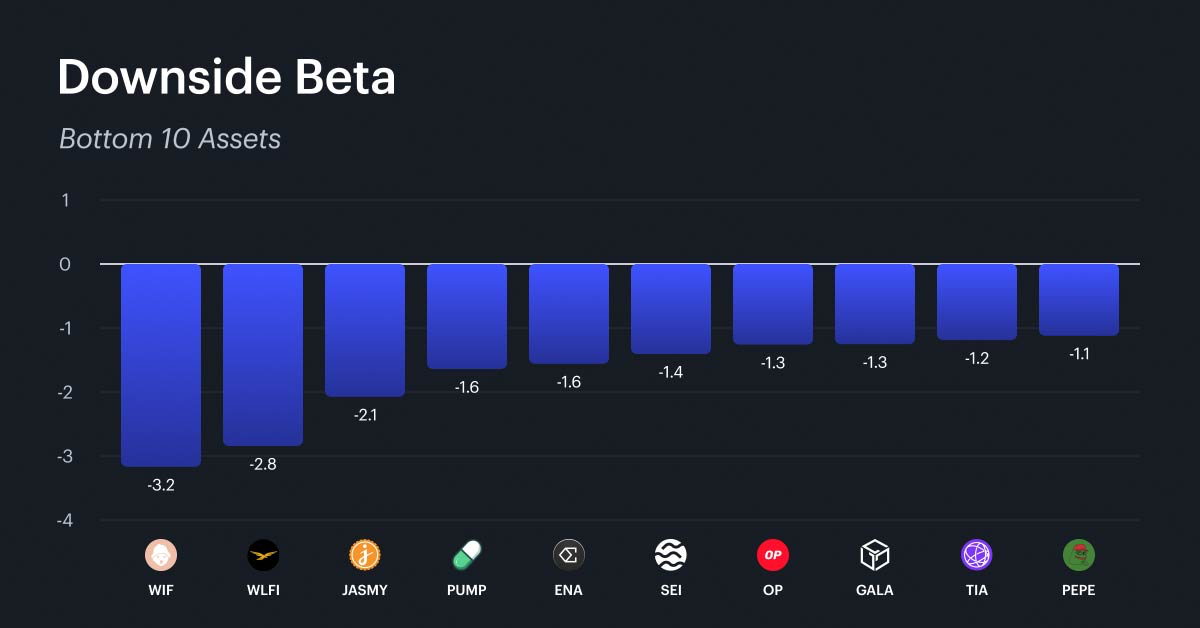
Downside beta's decline continues to be one of the defining narratives of the past month. The factor declined 2.1% on the week and 4.4% over four weeks, and now sits in last place in the month-to-date rankings at -5.1%. Its year-to-date return of +3.8% still leads all factors, but the cushion has eroded sharply from +9.2% just five weeks ago. The top 10 remains concentrated among established layer-1 infrastructure and store-of-value assets, led by EOS at 3.9, followed by QNT at 0.7, FIL at 0.6, XRP at 0.4, and HBAR at 0.3. BTC appears at 0.1, confirming its role as a defensive anchor with modest sensitivity to the factor. The bottom 10 reveals which segments of the market are least defensive and most exposed to drawdowns. Meme coins, speculative DeFi protocols, gaming tokens, and newer layer-1 platforms dominate the lowest scores - these are the names that have participated most aggressively in recent sell-offs and would be expected to lead losses in the next leg lower.
What Factors are Driving Markets
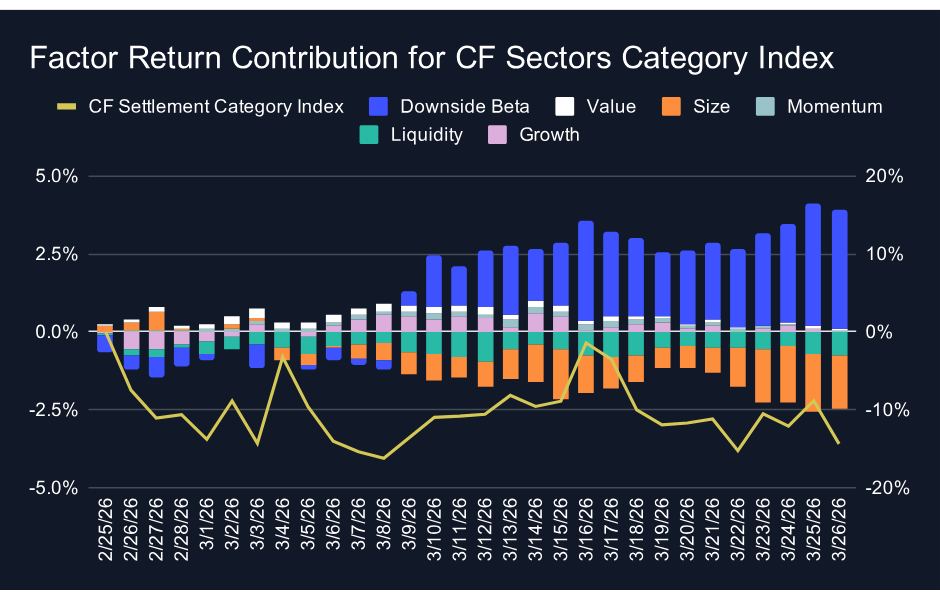
The Sectors category contribution chart shows the recent positive trend in daily factor contributions beginning to stall alongside this week's market pullback. The bars that had turned consistently positive in the most recent sessions last week are now showing mixed signals, with some days reverting to negative contributions. The cumulative weight of positive factor contributions from late February through early March continues to dominate the overall picture, and the index performance line remains in negative territory. For investors in tokens in the Sectors category, the message is that the factor environment has not yet shifted decisively in their favor. The improvement seen in mid-March is beginning to fade, but the category needs a more durable stretch of negative factor contribution before the cumulative picture turns net negative.
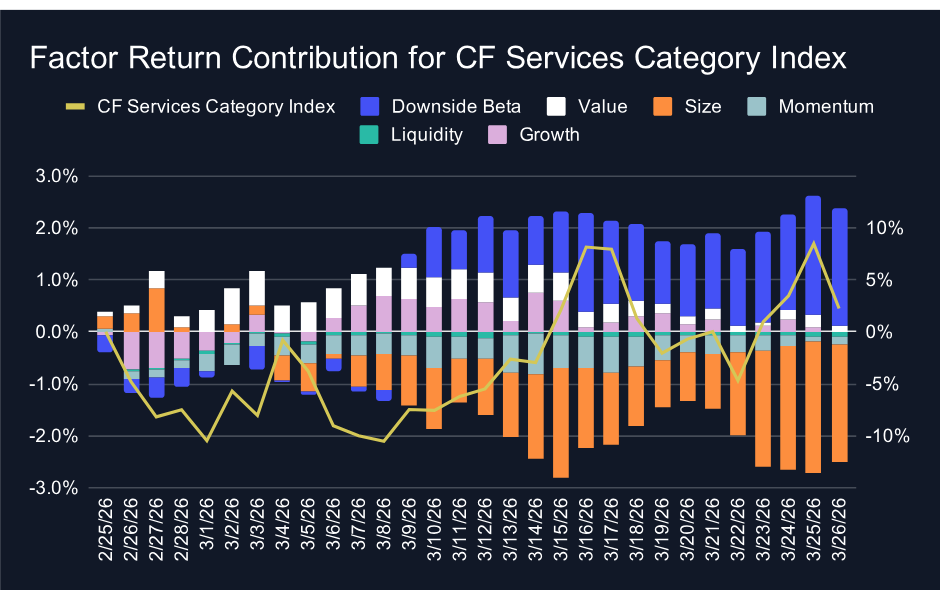
The Services category presents a notable disconnect this week. The cumulative factor contributions remain positive over the trailing 30-day window, led primarily by downside beta, which has provided a steady tailwind for the category. Despite this positive factor backdrop, the index performance line has turned negative, erasing the gains that had pushed the category to nearly +10% at its mid-March peak. This divergence means that idiosyncratic and residual effects are dragging performance below what the factor contributions alone would imply. In practical terms, the tokens in the Services category are underperforming their factor exposure, which suggests that selling pressure is concentrated in category-specific names rather than being driven by broad factor dynamics. For investors, this is a cautionary signal: even when the factor exposure is constructive, category-level performance can diverge if sentiment or flows turn against specific assets within the group.
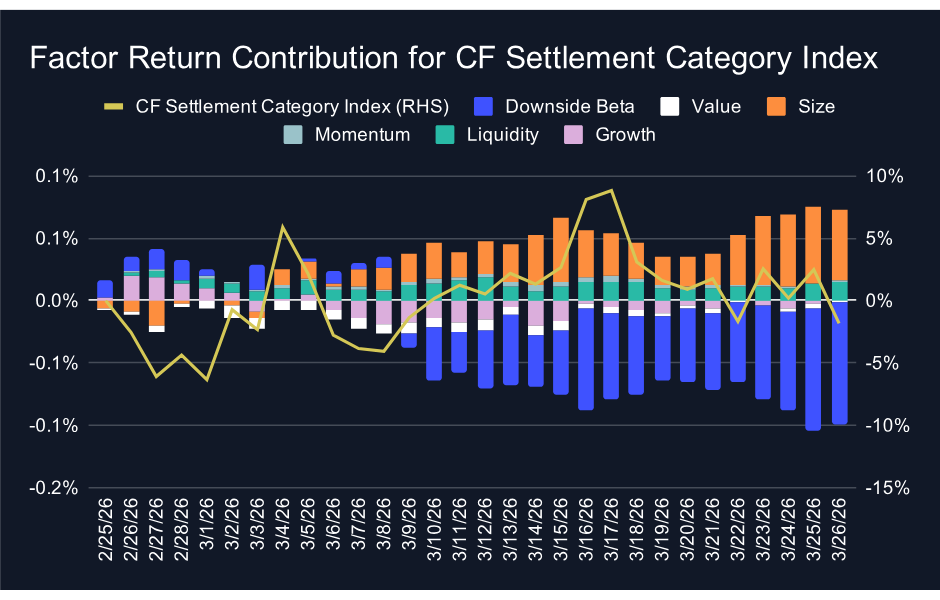
The Settlement category continues to stand apart from the other two. Factor contributions have been positive throughout the majority of the period, led by downside beta and size. The index performance line remains in positive territory, and the alignment between positive factor contributions and positive index performance gives the recovery in tokens in the Settlement category a more durable foundation than what is visible in Sectors or Services. The concentration of large-cap blue-chip tokens in Settlement continues to provide the compositional advantage that has defined this category throughout the drawdown and into the recovery. Even with this week's pullback, Settlement's factor-supported recovery remains the most structurally sound of the three categories.
Appendix: CF Factor Methodology
Market Factor
The market factor captures the broad, systematic risk that permeates the digital asset ecosystem. It reflects aggregate influences such as macroeconomic conditions, investor sentiment, and overall market volatility. As such, this factor is defined by the daily returns of the CF Broad Cap (Free Float Market Cap Weight) Index, offering a comprehensive and capitalization-weighted representation of the asset class.
Size Factor
The size factor captures the return differential associated with asset scale, reflecting the hypothesis that smaller-cap digital assets tend to outperform their larger-cap counterparts. This effect is understood to compensate for elevated operational and financial risks while exploiting potential market inefficiencies. In this framework, the size factor is defined by each asset’s fully diluted market capitalization. The value is sign-inverted so that higher z-scores are assigned to smaller assets and vice-versa.
Value Factor
The value factor reflects a protocol’s ability to generate economic output relative to its capital base and market valuation, combining measures of both efficiency and user engagement. It is constructed as the average z-score of two key ratios: transaction fees relative to total value locked (Fees/TVL) and daily active users relative to market capitalization (DAU/MCap). This composite metric captures how productively a protocol utilizes its resources while also serving as a proxy for user-driven demand. A higher combined score indicates efficient resource utilization and strong user engagement.
Momentum Factor
The momentum factor captures short-term price persistence by identifying assets that have recently exhibited strong performance. It is computed as the average z-score of two metrics: the 2 weeks cumulative performance and the 2 weeks risk-adjusted cumulative performance. This approach aligns with established findings in traditional financial literature and demonstrates empirical relevance in digital assets, where price trends tend to exhibit momentum over short horizons.
Growth Factor
The growth factor captures the expansion of a protocol’s network activity and user adoption. In the context of digital assets, it reflects metrics such as fee generation and user engagement, which serve as indicators of increased platform utilization and operational scale. The factor is defined as the average z-score of 30-day fee growth and 30-day weekly active user growth, thereby identifying assets exhibiting consistent and measurable increases in underlying network usage.
Downside Beta
The downside beta factor captures an asset’s sensitivity to adverse market conditions by isolating its behavior during periods of negative market returns. Empirical evidence shows that assets with lower downside beta tend to outperform their higher-beta counterparts over the long-term, due to their reduced participation in market drawdowns and more stable return profiles during periods of elevated volatility. As such, it is estimated through a regression of the asset’s daily returns over the most recent four-week period against market returns observed exclusively during negative sessions. The resulting value is sign-inverted to ensure that assets with lower downside exposure are assigned higher z-scores.
Liquidity Factor
The liquidity factor captures the ease with which a digital asset can be traded without significantly impacting its price. Empirical evidence shows that illiquid assets tend to command a higher risk premium than their more liquid counterparts, serving as compensation for trading friction and price volatility. To quantify this, the factor is measured using token turnover, defined as trading volume as a percentage of circulating supply. The value is sign-inverted such that higher z-scores are assigned to less liquid assets.
For further detail, view the CF Factors Methodology Document, the CF Factor Data Suite, and Our paper “A Factor Model for Digital Assets” in Springer Nature’s Mathematical Research for Blockchain Economy
The information contained within is for educational and informational purposes ONLY. It is not intended nor should it be considered an invitation or inducement to buy or sell any of the underlying instruments cited including but not limited to cryptoassets, financial instruments or any instruments that reference any index provided by CF Benchmarks Ltd. This communication is not intended to persuade or incite you to buy or sell security or securities noted within. Any commentary provided is the opinion of the author and should not be considered a personalised recommendation. Please contact your financial adviser or professional before making an investment decision.
Note: Some of the underlying instruments cited within this material may be restricted to certain customer categories in certain jurisdictions.
Changes to the Token Market Price Benchmarks Series - Market Prices – 21 July 2026
The Administrator has confirmed changes to the Token Market Price Family for the period 14 July 2026 to 21 July 2026.

CF Benchmarks
Softer CPI Reprices July Hike Risk & Lifts Digital Assets
Digital assets extended their recovery over the past week as cooler US inflation prints repriced Fed expectations; the bid was broad across the large cap indices, growth factor leadership returned, stablecoin funding repriced lower, and stress stayed isolated in names hit by token-specific news.
Mark Pilipczuk
Notice of the Demising of CF Dai-Dollar Settlement Price and Spot Rate
The Administrator announces that it will demise the CF Dai-Dollar Settlement Price (DAIUSD_RR) and CF Dai-Dollar Spot Rate (DAIUSD_RTI) which are members of the CF Digital Asset Index Family.
CF Benchmarks
By clicking Accept, you consent to CF Benchmarks's use of cookies.
Visit Cookie Settings to learn how CF Benchmarks uses cookies and to adjust your preferences.