
Mar 20, 2026
Factor Friday - March 20, 2025
Liquidity Takes the Lead as the Market Posts Its Strongest Four-Week Move of 2026
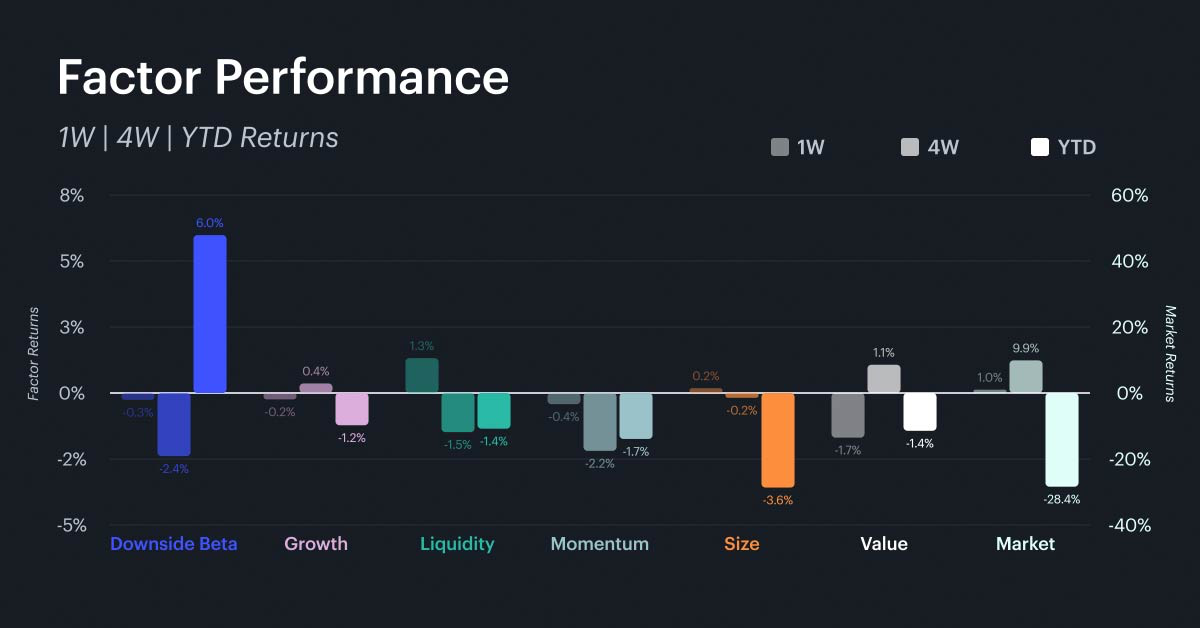
The market gained 1.0% on the week and has now rallied 9.9% over the trailing four weeks, its strongest move over a four-week period this year, narrowing the year-to-date loss to -28.4%. The surprise this week is liquidity, which topped the weekly factor rankings for the first time at +1.3%, a meaningful departure from the pattern of the past several months. Value, which had led the prior two weeks, reversed sharply at -1.7% on the week and has now slipped back to -1.4% year to date. Downside beta continued its retreat, falling 0.3% on the week and 2.4% over four weeks, though it still holds a diminished year-to-date lead at +6.0%. Growth was roughly flat on the week at -0.2% and remains down 1.2% on the year. The rotation that began with value and growth two weeks ago now appears to be broadening further into liquidity, suggesting that investor risk appetite is extending into less liquid segments of the market.
Rolling Factor Rankings and Rotation
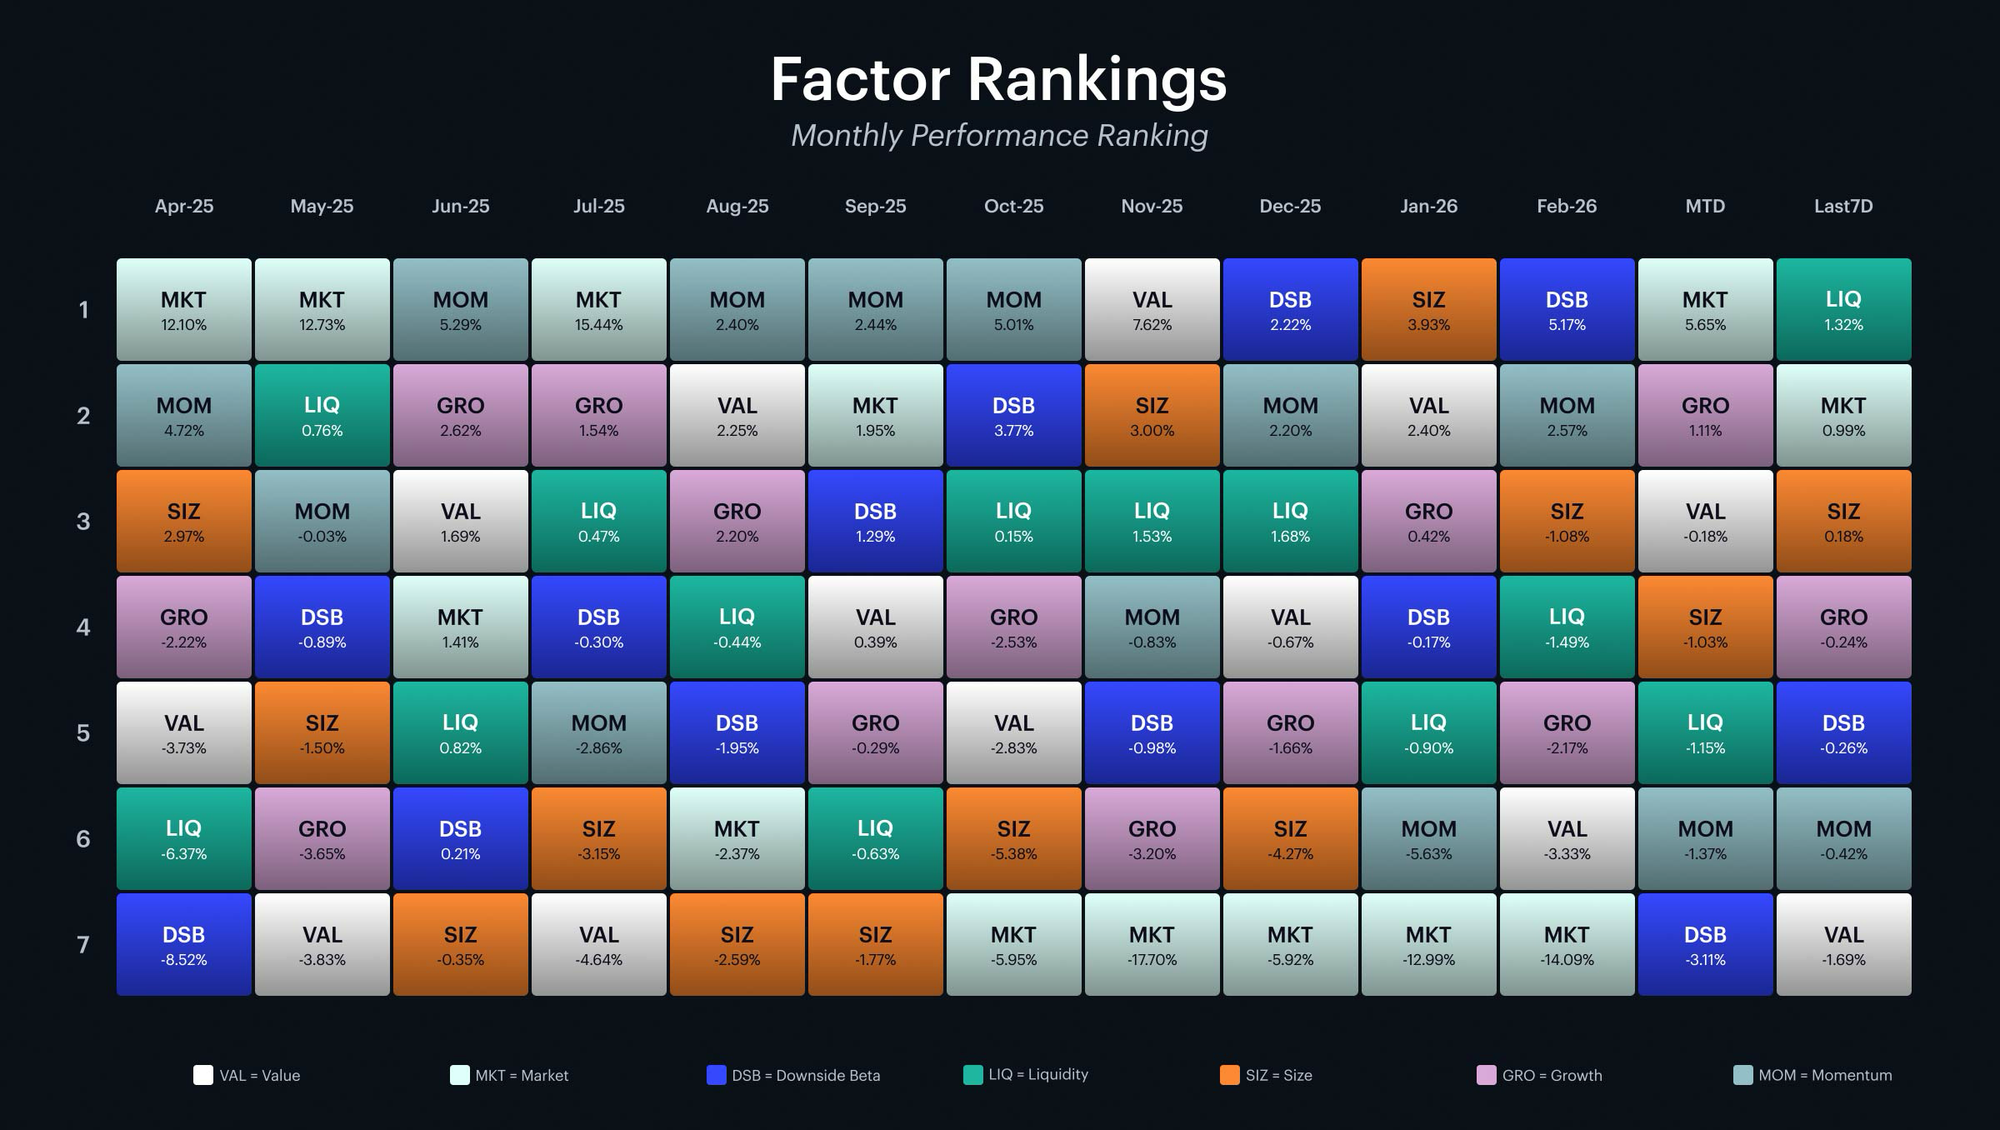
The quilt now shows liquidity at the top of the weekly rankings, the market factor leading month-to-date for the third consecutive week at +5.7%, and downside beta in last place on a monthly basis at -3.1%. The progression over the past month tells a clear story of broadening risk appetite. In the week of March 6, the rotation began with value and growth leading the weekly standings. The following week, growth moved to first with value in second. Now, liquidity has taken the top spot, with the market factor in second. Each week has seen a different factor lead, but the direction of the rotation has been consistent: away from defensiveness and toward risk. Downside beta has moved from the top of the rankings in February to the bottom by mid-March. For investors, this week-to-week progression suggests that the rotation is broadening rather than concentrating. That is a healthier signal than a single factor leading repeatedly, and it gives more confidence that the shift away from purely defensive positioning is durable. However, the market remains down 28% year to date, and a full pivot to risk-on positioning is premature until the factor rotation is confirmed over a longer horizon.
Market and Key Factor Betas
Market Beta
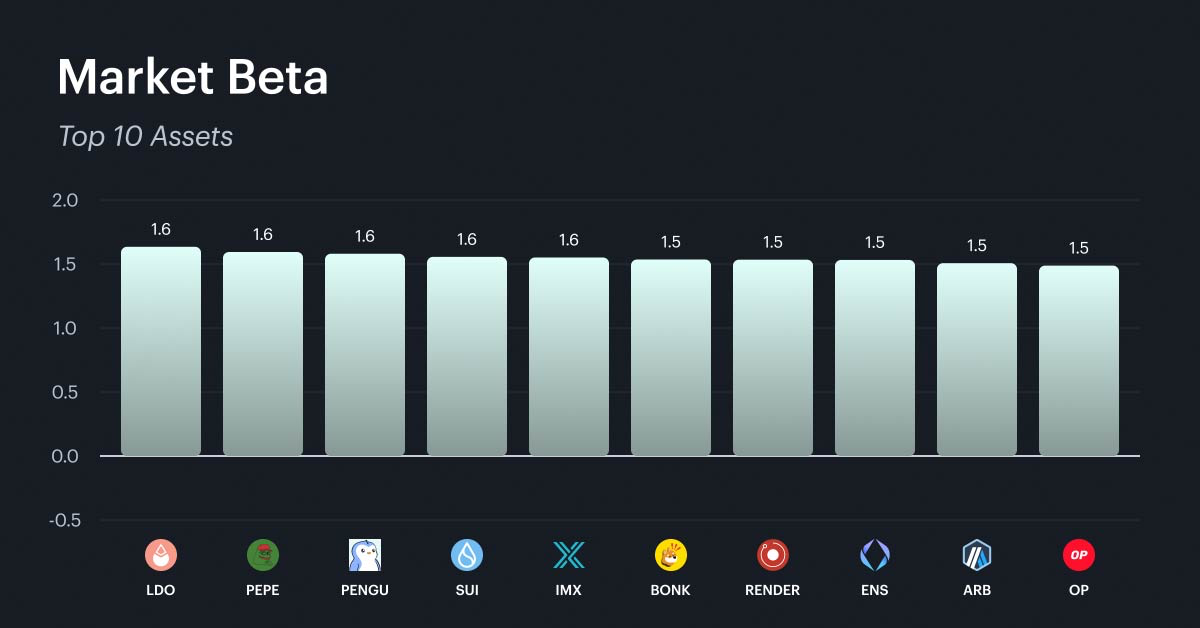
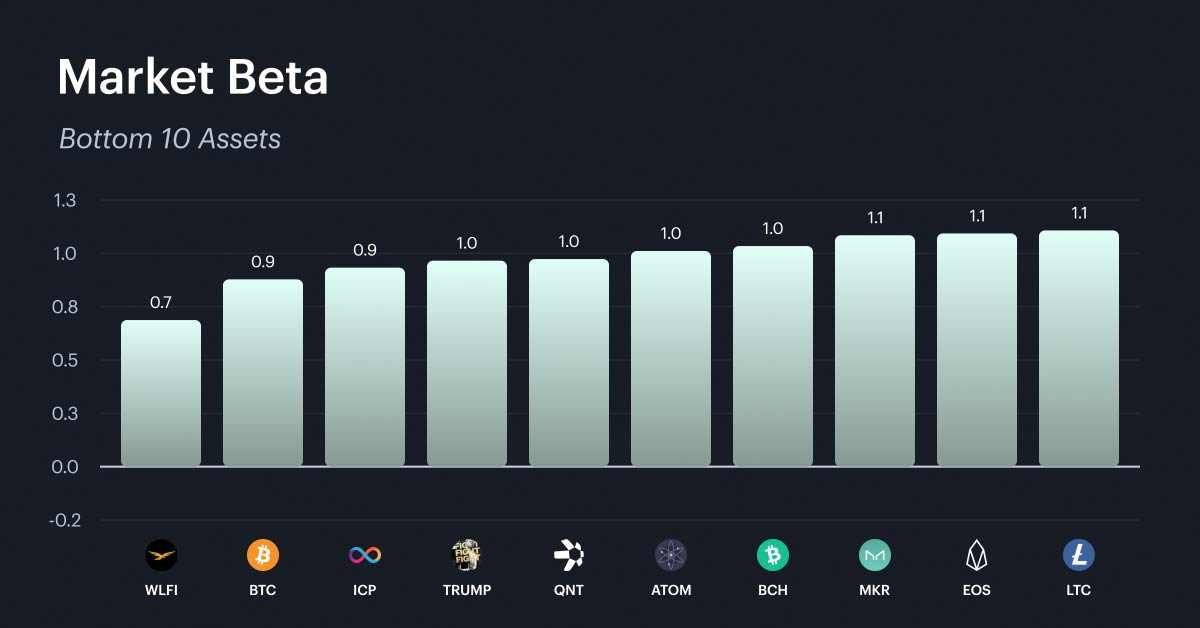
The market beta rankings remain stable for the fourth consecutive week. The high-beta cohort is unchanged: meme coins, newer layer-1 and layer-2 platforms, and DeFi infrastructure tokens continue to cluster between 1.5 and 1.6. The low-beta end is similarly persistent, anchored by governance tokens, Bitcoin, and a group of established store-of-value and infrastructure-layer protocols. The stability of these rankings through what has been a significant month of factor rotation is notable. It tells us that while factor leadership has shifted dramatically from downside beta to value to growth to liquidity, the underlying directional risk profile of individual assets has not changed. The +9.9% four-week market rally has disproportionately benefited high-beta names. Investors who rotated toward lower-beta names during the drawdown should be cautious about chasing high-beta performance at this stage, as the rally has not yet been confirmed by a sustained shift in factor based fundamentals.
Liquidity
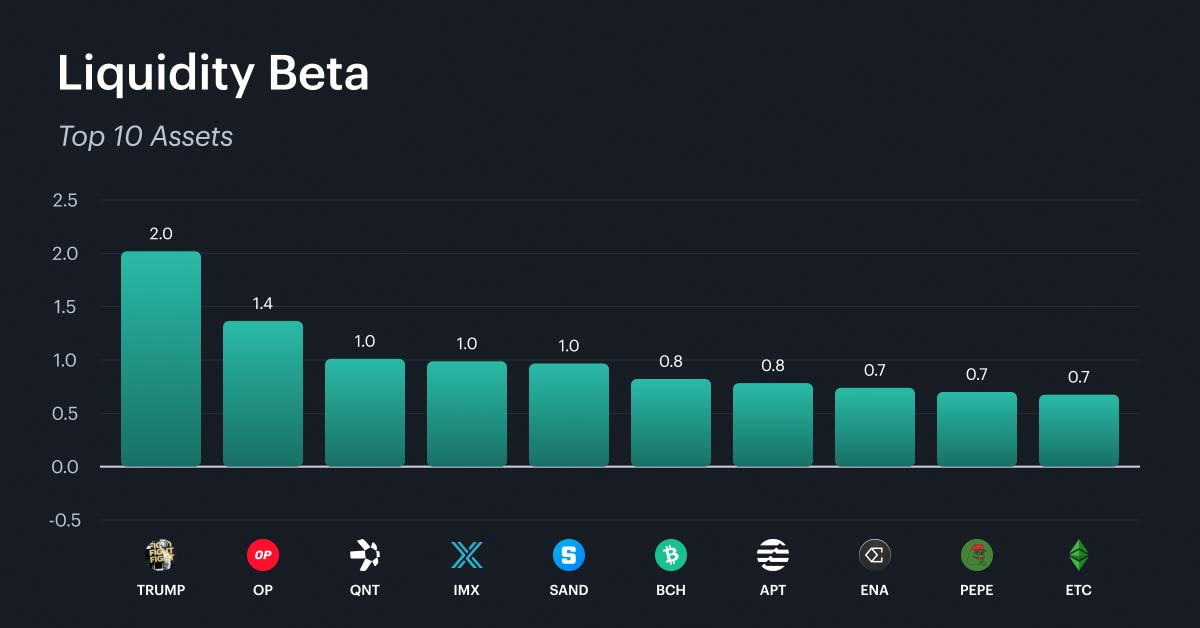
Liquidity's move to the top of the weekly rankings makes this factor the most timely to examine. The factor captures the premium investors earn for holding assets that are less traded. The top 10 is dominated by politically-linked and governance tokens, gaming and metaverse platforms, mid-cap layer-1s, and a handful of meme coins. These are segments of the market characterized by thinner order books, lower turnover relative to circulating supply, and greater sensitivity to directional flows. In a recovering market environment, illiquid assets tend to outperform because even modest buying pressure can move prices significantly. The 1.3% weekly return for the factor is consistent with this dynamic. For investors, the liquidity factor's emergence is a double-edged signal. On one hand, it suggests that capital is flowing into less trafficked corners of the market, which is typically a risk-on indicator. On the other hand, the same illiquidity that amplifies gains on the way up will amplify losses on the way down. Sizing illiquid positions accordingly is essential if looking to add exposure to this part of the market.
Downside Beta
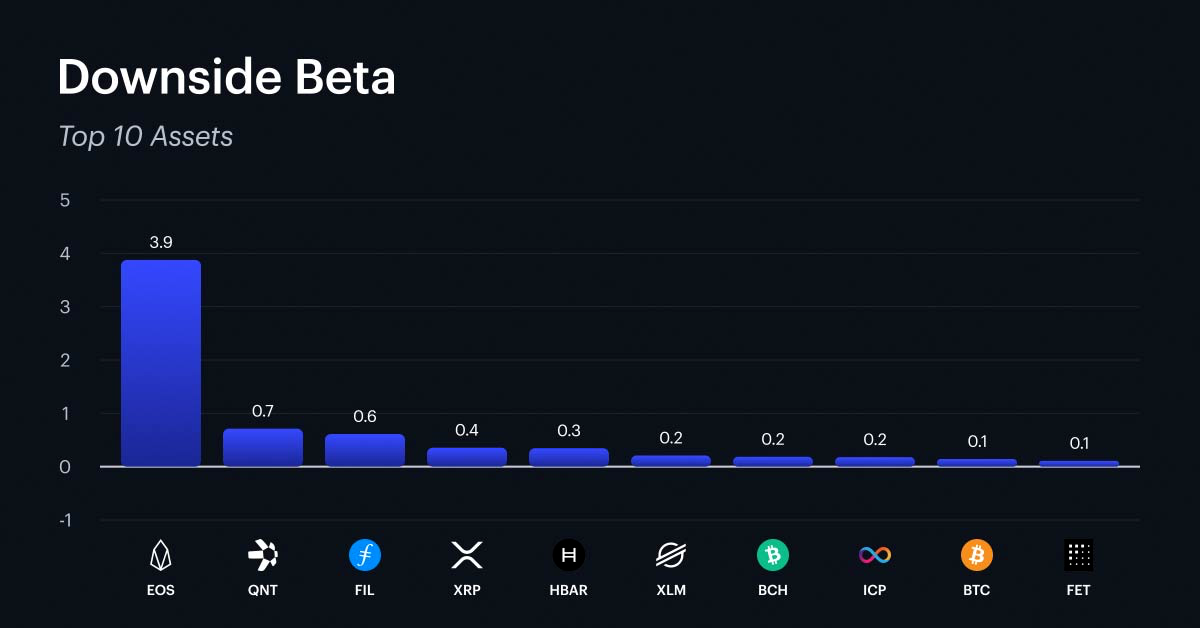
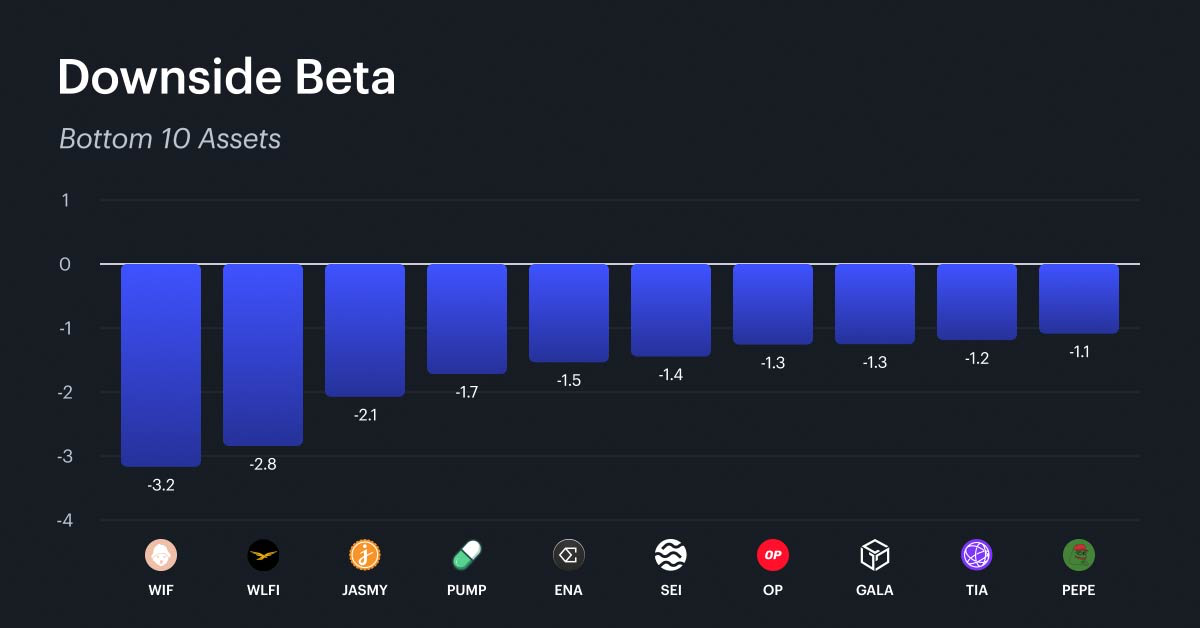
Downside beta's decline continues to be one of the defining narratives of the past month. The factor posted -0.3% on the week and -2.4% over four weeks, and has now fallen to last place in the month-to-date rankings at -3.1%. Its year-to-date return of +6.0% still leads all factors, but the cushion is eroding rapidly. The top 10 remains concentrated among established layer-1 infrastructure and store-of-value assets. The bottom 10 reveals which segments of the market are least defensive and most exposed to drawdowns. Meme coins, newly listed governance tokens , speculative DeFi protocols , and newer layer-1 platforms dominate the lowest scores. These are the names that have participated most aggressively in recent sell-offs and would be expected to lead losses in the next leg lower. For investors, the key question is how much of the defensive allocation to unwind. If the market continues to recover, downside beta will likely continue to underperform as capital rotates into higher-risk segments. But if the rally stalls and selling resumes, the assets with the highest downside beta scores are likely to be the most resilient.
What Factors are Driving Markets
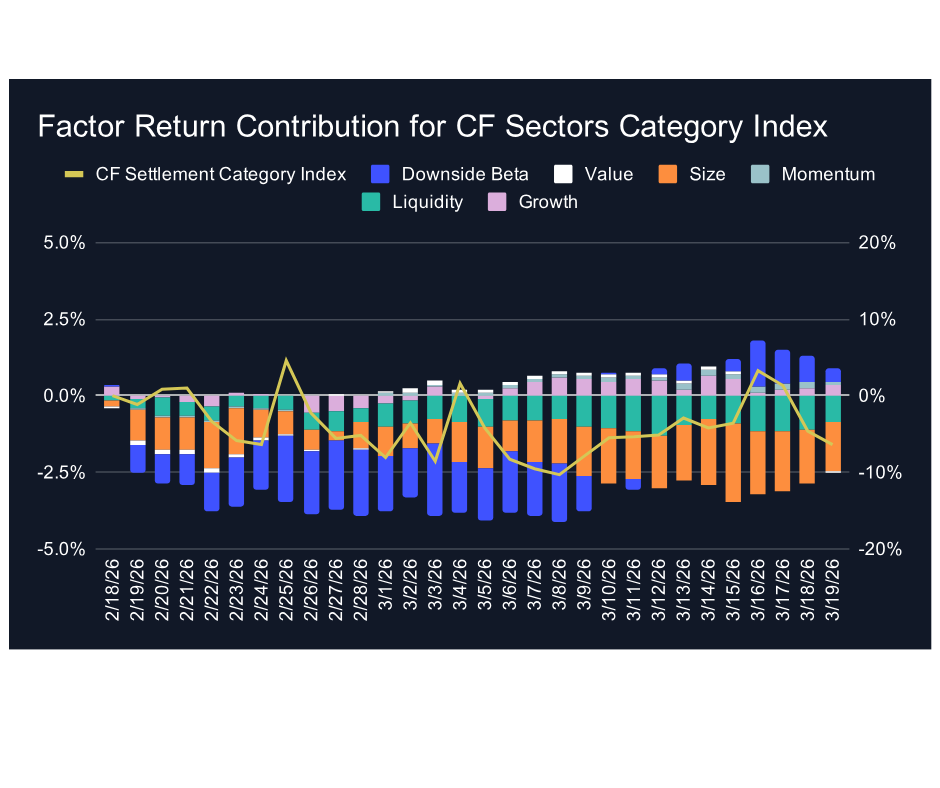
The Sectors category contribution chart shows a notable evolution over the trailing 30 days. The early part of the window (mid to late February) saw deep negative factor contributions across the board, with downside beta, size, and liquidity all detracting heavily. The most recent sessions show factor contributions turning positive, with the stacked bars moving above zero from around mid-March onward. Despite this recent improvement, the index performance line has not fully recovered and remains in negative territory over the full period. The cumulative weight of the early-period negative factor contributions continues to weigh on the overall picture, even though the more recent daily contributions have improved. For investors in tokens in the Sectors category, the shift to positive daily factor contributions is an encouraging development, but the category needs several more sessions of positive factor contribution before the cumulative picture turns net positive.
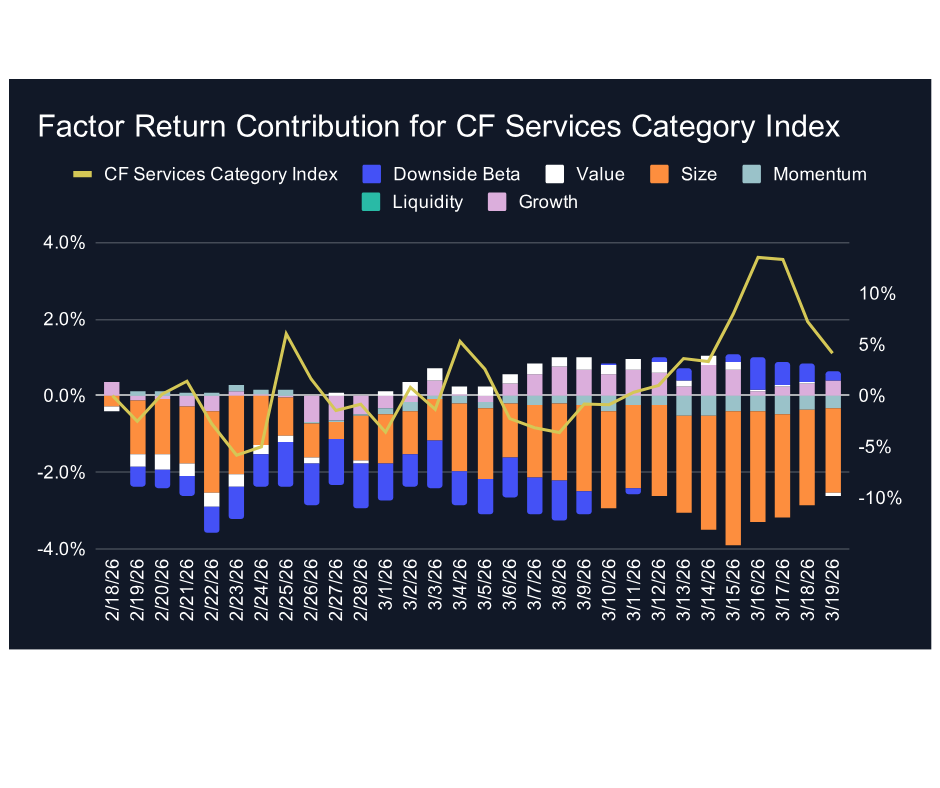
The Services category presents the most interesting disconnect of the three categories this week. The index performance line surged to nearly +10% on the right-hand axis around mid-March before pulling back, and remains in positive territory. Meanwhile, the underlying factor contributions, though improving in recent sessions, are still cumulatively negative over the full 30-day window. The daily bars have been turning positive in the most recent week, driven primarily by downside beta and growth, but the deep negative cumulative factor contributions from late February through early March have not been fully offset. This means the rally in tokens in the Services category continues to be more driven by market beta than positive factor contribution. The factor picture is improving directionally, but until the cumulative contribution turns positive, the recovery remains vulnerable to a pullback if sentiment shifts.
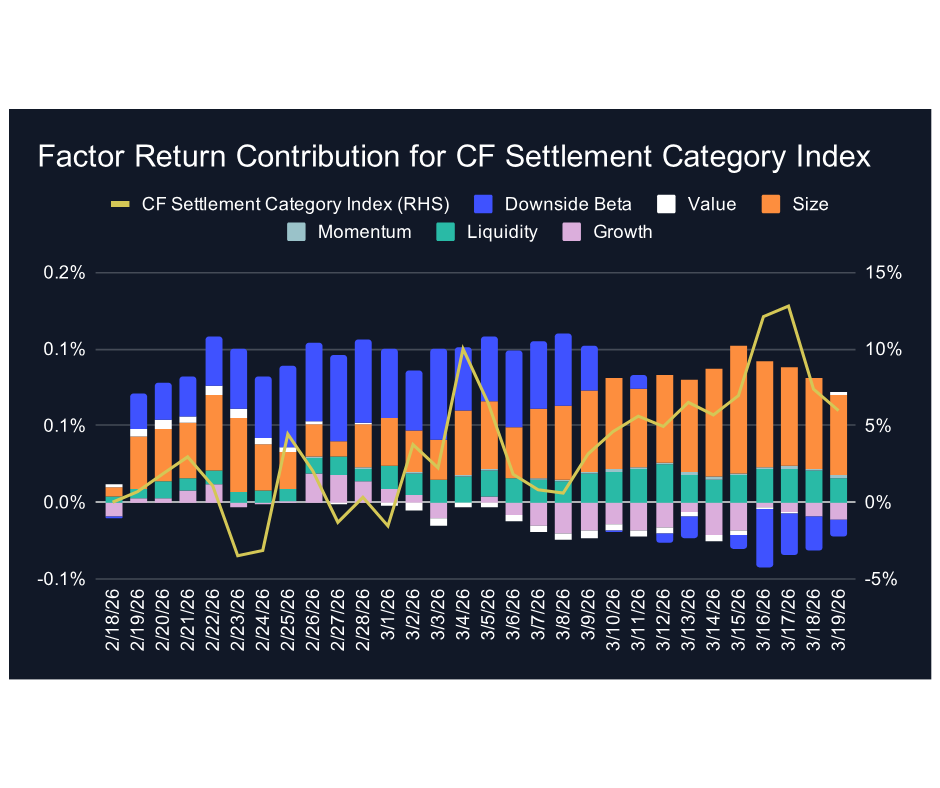
The Settlement category continues to stand apart from the other two. Factor contributions have been positive throughout the majority of the period, led by downside beta and size. The index performance line has been volatile but remains in positive territory, and the alignment between positive factor contributions and positive index performance gives the recovery in tokens in the Settlement category a more durable foundation than what is visible in Sectors or Services. The concentration of large-cap blue-chip tokens in Settlement continues to provide the compositional advantage that has defined this category throughout the drawdown and into the recovery.
Appendix: CF Factor Methodology
Market Factor
The market factor captures the broad, systematic risk that permeates the digital asset ecosystem. It reflects aggregate influences such as macroeconomic conditions, investor sentiment, and overall market volatility. As such, this factor is defined by the daily returns of the CF Broad Cap (Free Float Market Cap Weight) Index, offering a comprehensive and capitalization-weighted representation of the asset class.
Size Factor
The size factor captures the return differential associated with asset scale, reflecting the hypothesis that smaller-cap digital assets tend to outperform their larger-cap counterparts. This effect is understood to compensate for elevated operational and financial risks while exploiting potential market inefficiencies. In this framework, the size factor is defined by each asset’s fully diluted market capitalization. The value is sign-inverted so that higher z-scores are assigned to smaller assets and vice-versa.
Value Factor
The value factor reflects a protocol’s ability to generate economic output relative to its capital base and market valuation, combining measures of both efficiency and user engagement. It is constructed as the average z-score of two key ratios: transaction fees relative to total value locked (Fees/TVL) and daily active users relative to market capitalization (DAU/MCap). This composite metric captures how productively a protocol utilizes its resources while also serving as a proxy for user-driven demand. A higher combined score indicates efficient resource utilization and strong user engagement.
Momentum Factor
The momentum factor captures short-term price persistence by identifying assets that have recently exhibited strong performance. It is computed as the average z-score of two metrics: the 2 weeks cumulative performance and the 2 weeks risk-adjusted cumulative performance. This approach aligns with established findings in traditional financial literature and demonstrates empirical relevance in digital assets, where price trends tend to exhibit momentum over short horizons.
Growth Factor
The growth factor captures the expansion of a protocol’s network activity and user adoption. In the context of digital assets, it reflects metrics such as fee generation and user engagement, which serve as indicators of increased platform utilization and operational scale. The factor is defined as the average z-score of 30-day fee growth and 30-day weekly active user growth, thereby identifying assets exhibiting consistent and measurable increases in underlying network usage.
Downside Beta
The downside beta factor captures an asset’s sensitivity to adverse market conditions by isolating its behavior during periods of negative market returns. Empirical evidence shows that assets with lower downside beta tend to outperform their higher-beta counterparts over the long-term, due to their reduced participation in market drawdowns and more stable return profiles during periods of elevated volatility. As such, it is estimated through a regression of the asset’s daily returns over the most recent four-week period against market returns observed exclusively during negative sessions. The resulting value is sign-inverted to ensure that assets with lower downside exposure are assigned higher z-scores.
Liquidity Factor
The liquidity factor captures the ease with which a digital asset can be traded without significantly impacting its price. Empirical evidence shows that illiquid assets tend to command a higher risk premium than their more liquid counterparts, serving as compensation for trading friction and price volatility. To quantify this, the factor is measured using token turnover, defined as trading volume as a percentage of circulating supply. The value is sign-inverted such that higher z-scores are assigned to less liquid assets.
For further detail, view the CF Factors Methodology Document, the CF Factor Data Suite, and Our paper “A Factor Model for Digital Assets” in Springer Nature’s Mathematical Research for Blockchain Economy
The information contained within is for educational and informational purposes ONLY. It is not intended nor should it be considered an invitation or inducement to buy or sell any of the underlying instruments cited including but not limited to cryptoassets, financial instruments or any instruments that reference any index provided by CF Benchmarks Ltd. This communication is not intended to persuade or incite you to buy or sell security or securities noted within. Any commentary provided is the opinion of the author and should not be considered a personalised recommendation. Please contact your financial adviser or professional before making an investment decision.
Note: Some of the underlying instruments cited within this material may be restricted to certain customer categories in certain jurisdictions.
Factor Friday - July 31, 2026
July's rally has stalled, with the Market factor flat at +0.02% and its four-week gain down to +0.48% from +7.13%. Momentum led a second straight week at +1.96%, its first back-to-back run since late May, while Growth reversed to +1.74% and Value fell to the bottom at -1.93%.

Mark Pilipczuk
Changes to the Token Market Price Benchmarks Series - Market Prices – 28 July 2026
Changes to the Token Market Price Benchmarks Series - Market Prices – 28 July 2026
CF Benchmarks
Digital Assets Absorb Hawkish Repricing Ahead of the FOMC
Digital assets traded through a hawkish macro surprise this week but closed mostly higher, with breadth holding across major names and indices. Sector leadership traced to a single regulatory catalyst, not a broad rotation, and implied volatility stayed firmer than realized into the weekend.
Mark Pilipczuk
By clicking Accept, you consent to CF Benchmarks's use of cookies.
Visit Cookie Settings to learn how CF Benchmarks uses cookies and to adjust your preferences.