
Apr 03, 2026
Factor Friday - April 3, 2026
Liquidity Returns to the Top as Value Sells Off Sharply
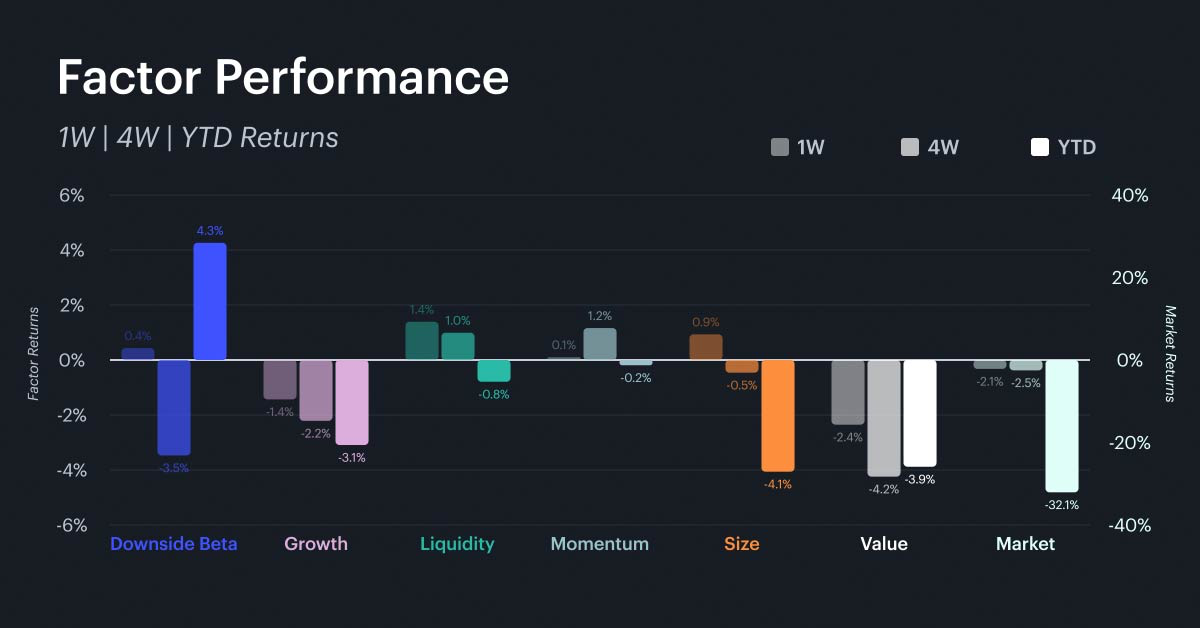
The market declined 2.15% on the week, extending the year-to-date loss to -32.1%. Liquidity led the weekly factor rankings at +1.4%, reclaiming the top spot. Size followed at +0.9%, its strongest weekly showing in months. Downside beta posted a modest +0.4% on the week, a notable stabilization after five consecutive weeks of declines, though it remains down -3.5% over four weeks. Its year-to-date gain has held at +4.3%. Momentum was roughly flat at +0.1%. The laggards this week were value at -2.4% and growth at -1.4%, with value now down -4.2% over four weeks and -3.9% year to date. The sharp reversal in value is the most significant development this week. After leading the weekly rankings in early March, value has now posted back-to-back weeks of losses and sits at the bottom of both the weekly and monthly standings. The combination of liquidity and size leading while value sells off suggests that capital is rotating toward less liquid, smaller-cap segments of the market at the expense of names with strong fundamentals. This is a risk-on pattern that tends to coincide with speculative positioning rather than durable conviction.
Rolling Factor Rankings and Rotation
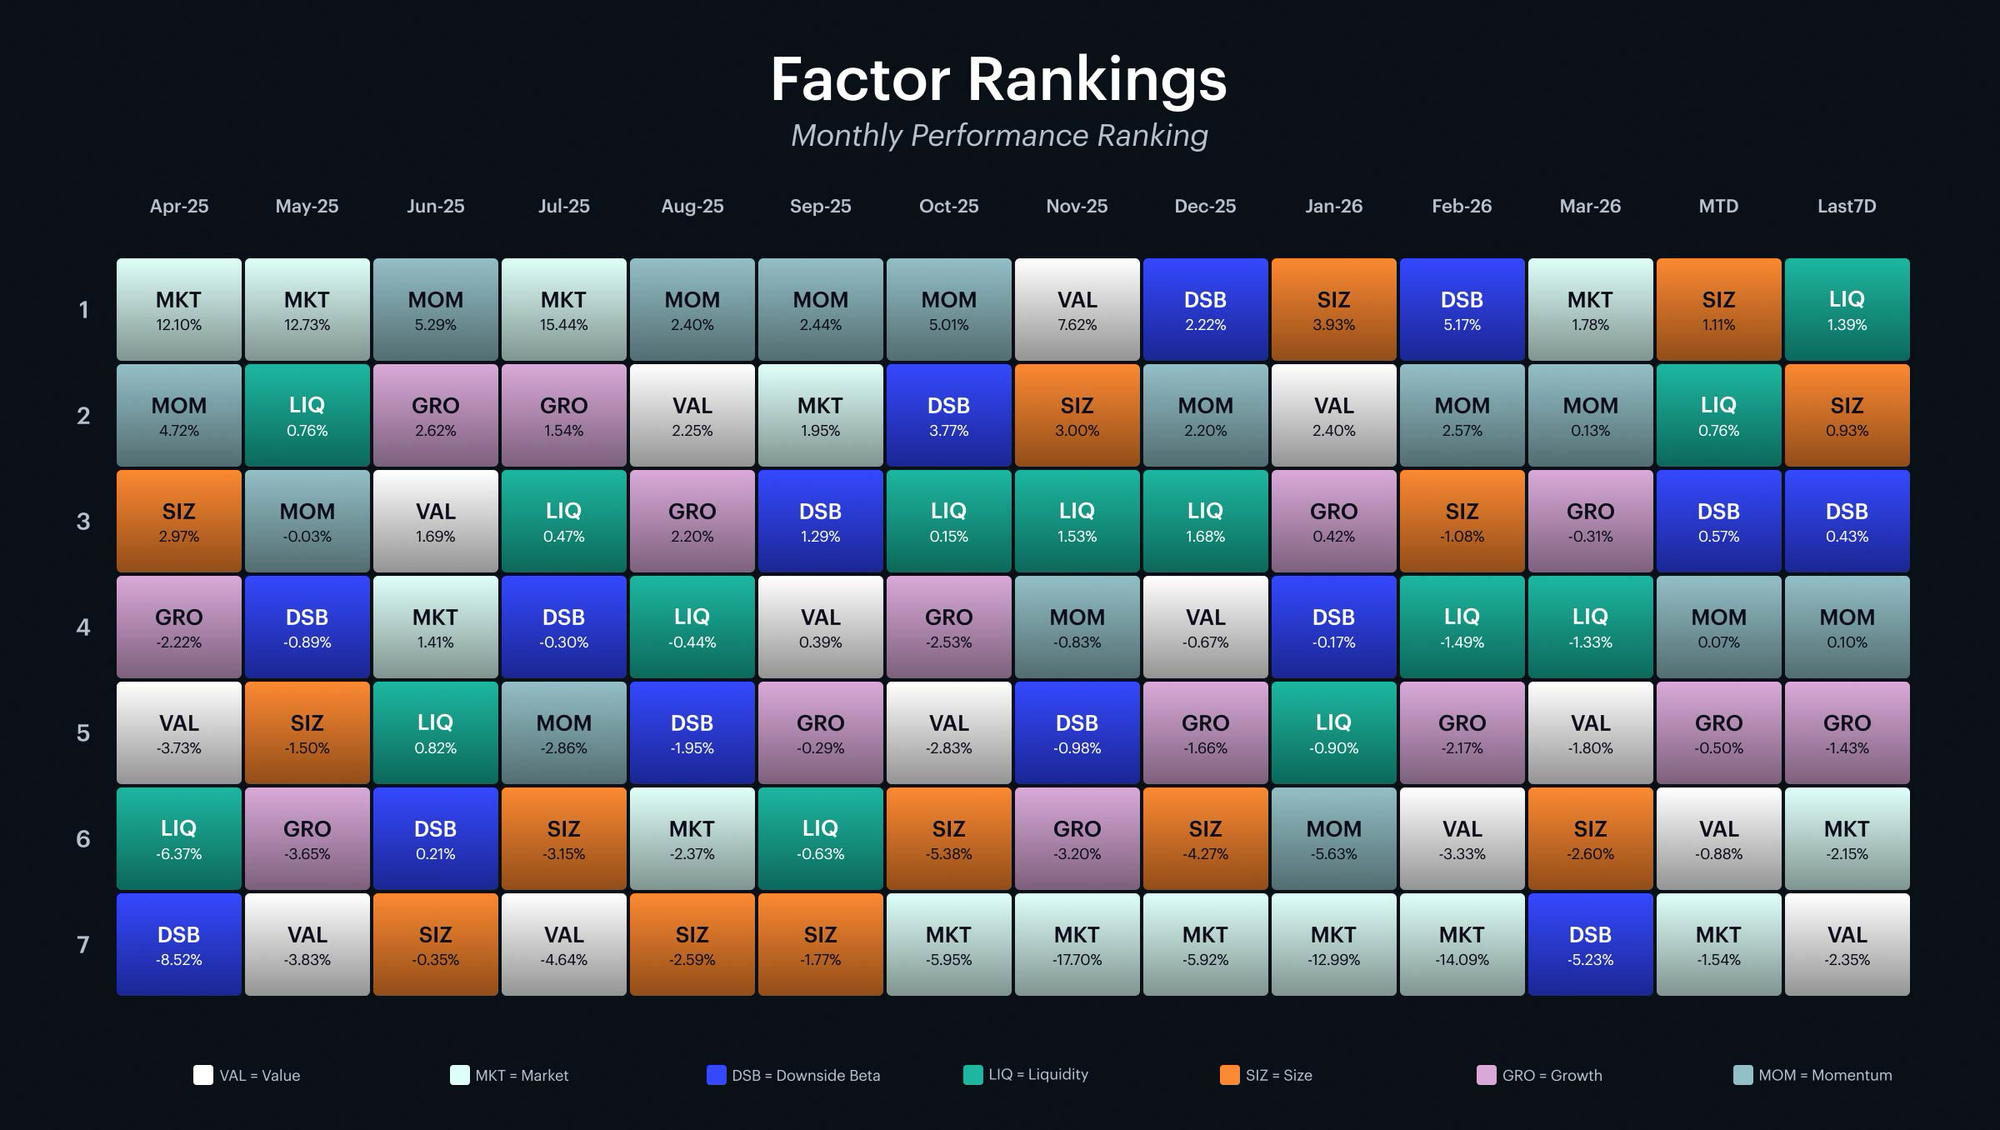
The quilt chart tells a striking story this week. Liquidity leads the weekly rankings at +1.4%, with size in second at +0.9% and downside beta in third at +0.4%. Value has fallen to last place at -2.4%, below even the market factor at -2.2%. On a month-to-date basis, size leads at +1.1%, followed by liquidity at +0.8% and downside beta at +0.6%, while value and the market factor sit at the bottom. Looking back at March, the market factor led at +1.8% while downside beta finished last at -5.2%. The transition into April has seen a meaningful shift: the factors associated with smaller, less liquid, and more defensive assets are now leading, while value and market - the factors tied to fundamentals and broad directional exposure - are lagging. The six-week rotation has now come full circle twice: from downside beta to value to growth to liquidity to momentum and now back to liquidity and size. For investors, the persistence of the rotation without a clear winner consolidating leadership is itself a signal. It suggests the market lacks strong conviction in any single theme and is cycling through factors opportunistically. Until one factor or group of factors establishes sustained leadership, tactical positioning remains more appropriate than concentrated bets.
Market and Key Factor Betas
Market Beta
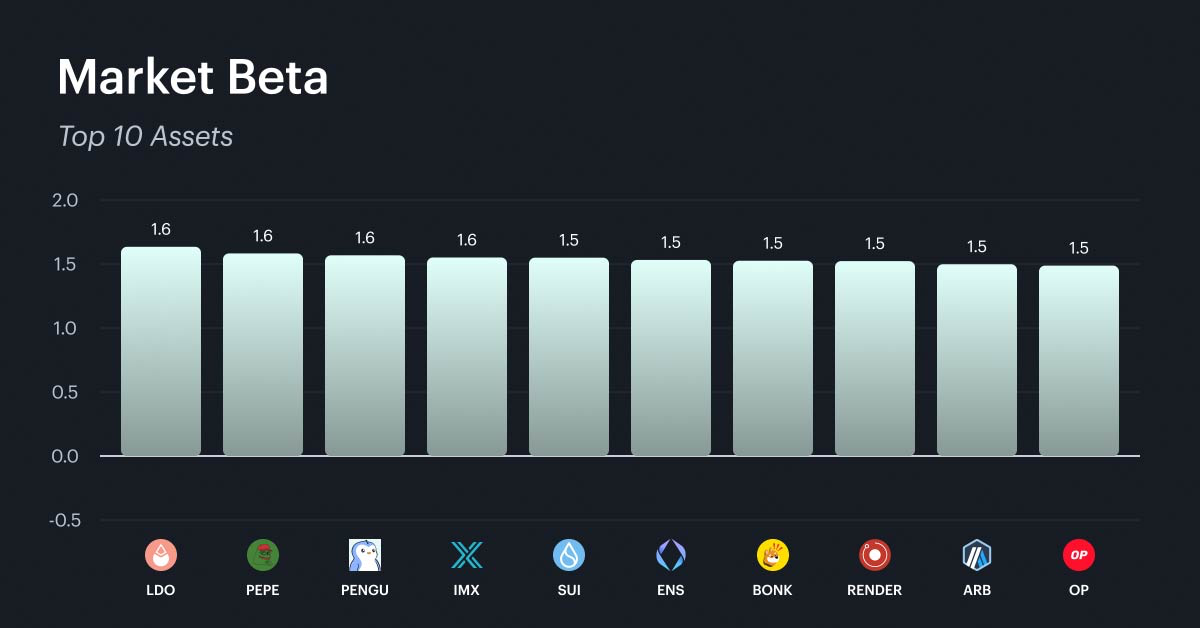
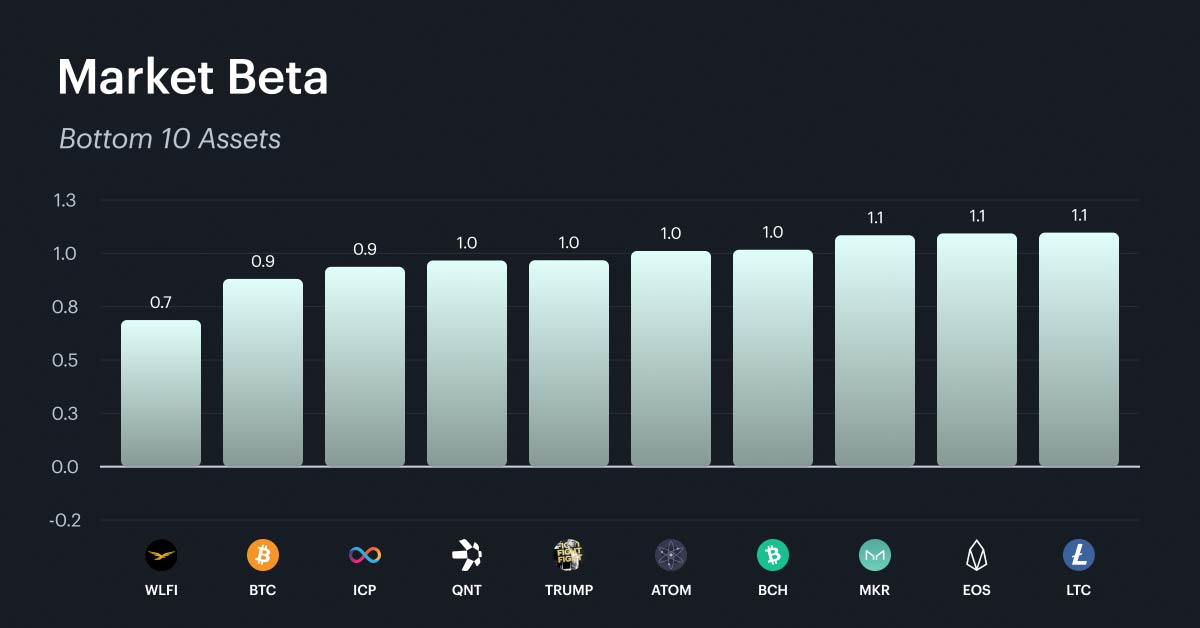
The market beta rankings remain stable for the sixth consecutive week. The high-beta cohort is unchanged: meme coins, newer layer-1 and layer-2 platforms, and DeFi infrastructure tokens continue to cluster between 1.5 and 1.6. The low-beta end is similarly persistent, anchored by WLFI at 0.7, BTC at 0.9, and a group of established protocols at or near 1.0. Six weeks of stability in these rankings through one of the most active periods of factor rotation in recent memory confirms that market beta is a structural characteristic rather than a cyclical one. For investors, the takeaway is straightforward: the names at the top of this list will continue to amplify both gains and losses regardless of which factor is leading.
Liquidity
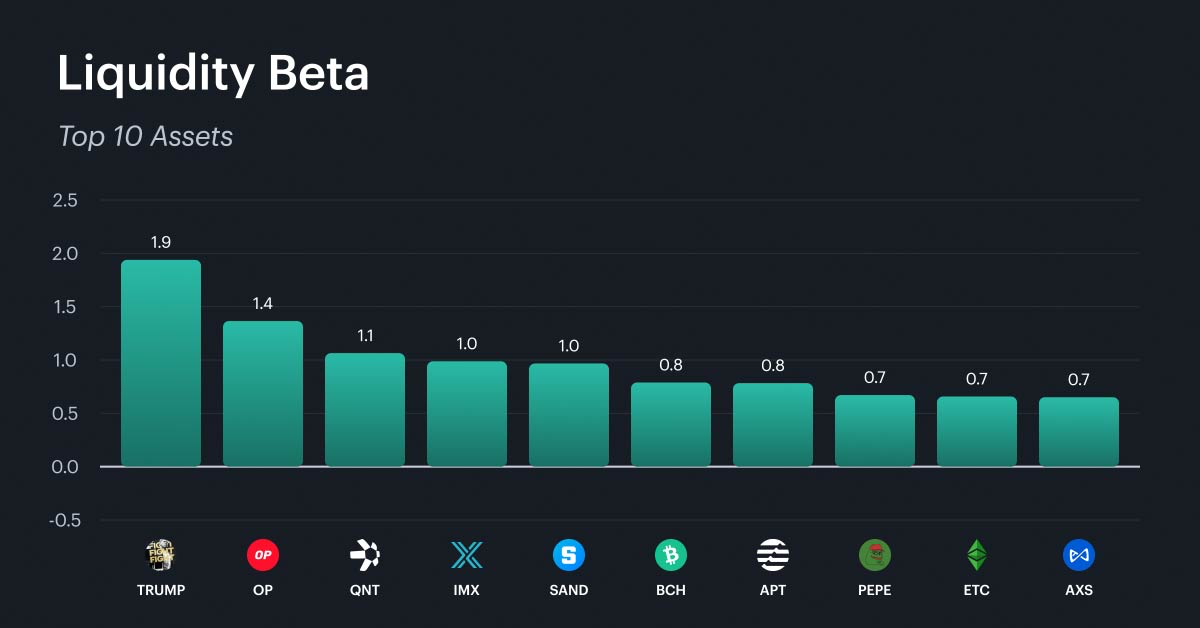
With liquidity reclaiming the top of the weekly rankings, this factor's beta distribution deserves attention. The liquidity factor is sign-inverted, meaning higher scores are assigned to less liquid assets, capturing the premium investors earn for holding assets that are harder to trade. The top 10 is led by TRUMP at 1.9, well ahead of the field, followed by OP at 1.4, QNT at 1.1, and IMX and SAND near 1.0. BCH, APT, PEPE, ETC, and AXS fill out the group between 0.7 and 0.8. The composition is telling: meme coins, mid-cap layer-1 and layer-2 platforms, and gaming tokens dominate the highest liquidity betas. These are segments characterized by thinner order books and lower turnover relative to circulating supply. In a market that declined 2.2% on the week, the liquidity factor's +1.4% return means these illiquid names outperformed significantly. This is consistent with speculative flows rotating into less trafficked corners of the market. For investors, the liquidity premium is real but carries meaningful execution risk. The same illiquidity that amplifies gains on the way up will likely amplify losses on the way down and exit costs in these names can be substantial during periods of elevated volatility.
Size
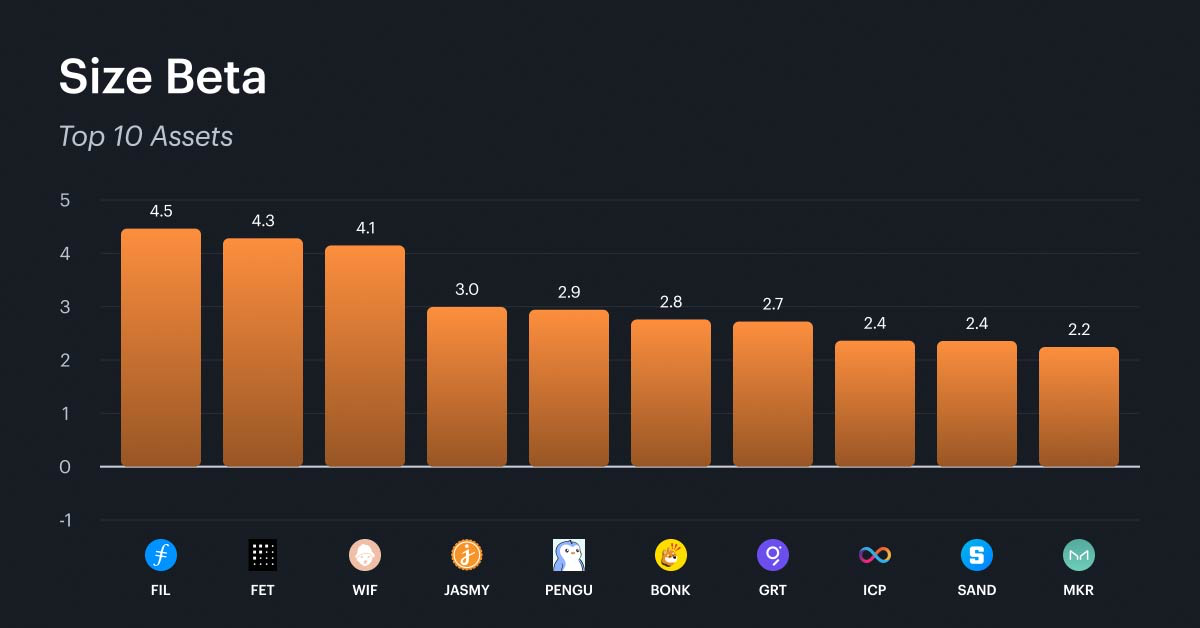
Size's emergence as the second-best performing factor this week and the month-to-date leader makes this an important beta to examine. The size factor is sign-inverted, meaning higher scores are assigned to smaller-cap assets. The top 10 is dominated by meme coins and smaller-cap infrastructure tokens, the same segments that tend to exhibit the highest volatility and most speculative trading activity. These are tokens with smaller fully diluted market capitalizations relative to the broader index, and their presence at the top of the size beta rankings explains why the factor is performing well in a week where liquidity is also leading. The +0.9% weekly return for size, combined with liquidity's +1.4%, indicates that the smallest and least liquid names are outperforming together. This combination is a classic risk appetite signal: investors are reaching further down the cap spectrum and accepting thinner liquidity in exchange for potential upside. For investors, the size factor's leadership this early in April, following a -32% year-to-date market decline, could indicate either a bottoming process where small-caps lead the recovery or a final bout of speculative rotation before another leg lower. The distinction matters, and position sizing should reflect the uncertainty.
What Factors are Driving Markets
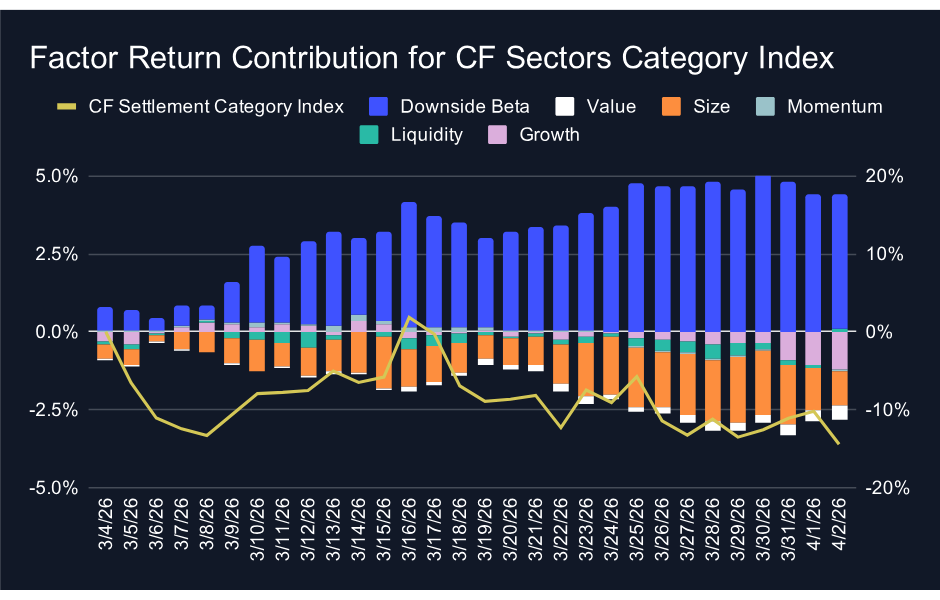
The Sectors category presents the widest disconnect between factor contributions and index performance of the three categories. Cumulative factor contributions over the trailing 30 days are net positive at approximately +1.6%, led by downside beta at +4.3%, which has provided a consistent tailwind. However, the index itself is down -14.4% over the same period. The roughly 16 percentage point gap between factor contributions and index performance means that the vast majority of the decline in tokens in the Sectors category is driven by residual and idiosyncratic effects not captured by the factor model. In practical terms, the factor environment has been modestly constructive, but category-specific selling pressure has overwhelmed it. For investors, this disconnect suggests that the underperformance in Sectors is not a factor story but rather a reflection of asset class specific headwinds.
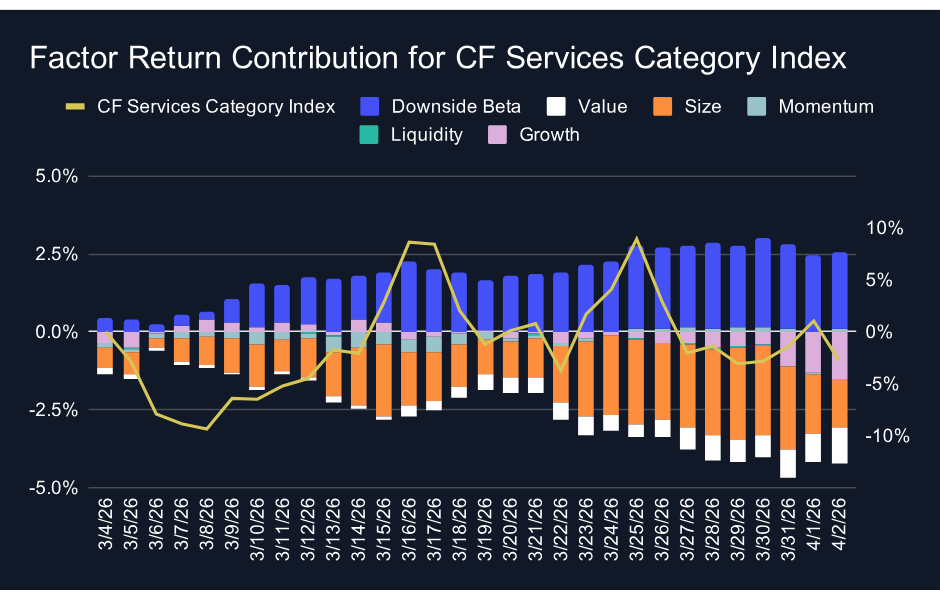
The Services category shows a narrower but still meaningful disconnect. Cumulative factor contributions stand at approximately -1.7%, with downside beta providing a positive contribution of +2.4% that is offset by negative contributions from growth at -1.5%, size at -1.6%, and value at -1.2%. The index performance sits at -2.7%, roughly one percentage point below the total factor contribution. While the gap is smaller than in Sectors, the direction is the same: the index is underperforming what the factor model alone would predict. The negative factor contributions from growth and value are consistent with this week's broader theme of fundamental factors lagging. For investors in tokens in the Services category, the factor picture is mixed but not catastrophic. The category's performance is tracking closer to its factor exposure than Sectors is, but the negative tilt from growth and value suggests that a recovery in Services will require those fundamentally-driven factors to stabilize.
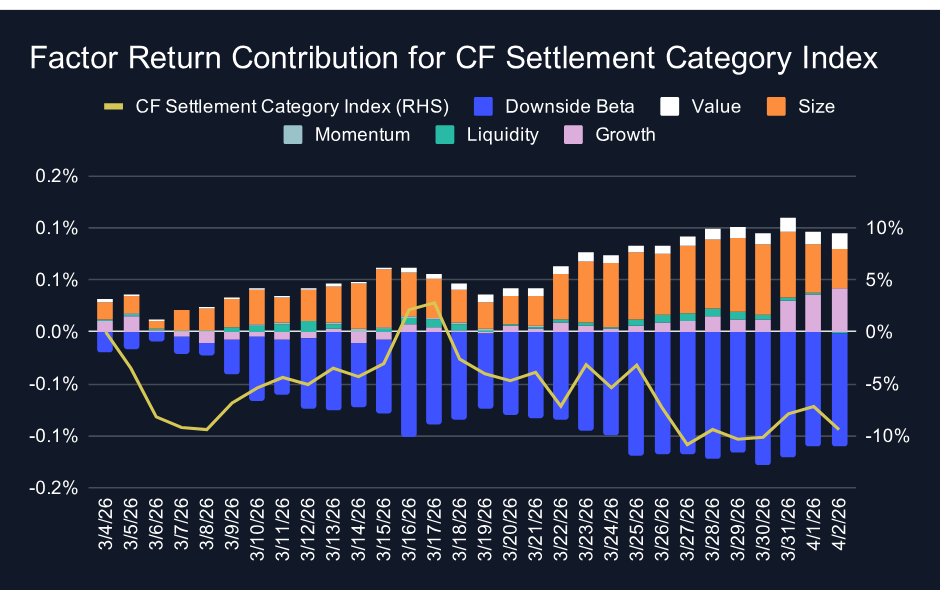
The Settlement category has undergone a notable shift from prior weeks. Factor contributions are effectively flat over the trailing 30 days, with individual factor contributions all near zero. This is typical for Settlement given its heavy concentration in large-cap tokens like BTC and ETH, which tend to have muted factor exposures. However, the index is down -9.4% over the period, a significant deterioration from the positive territory it occupied in prior weeks. The roughly 9 percentage point gap between flat factor contributions and the index decline means that the sell-off in tokens in the Settlement category is almost entirely a directional market move rather than a factor-driven one. For investors, Settlement's previous structural advantage, built on positive factor alignment, has eroded. The category is now subject to the same broad selling pressure as the rest of the market, and its factor-neutral positioning offers less differentiation than it did during the earlier stages of the drawdown.
Appendix: CF Factor Methodology
Market Factor
The market factor captures the broad, systematic risk that permeates the digital asset ecosystem. It reflects aggregate influences such as macroeconomic conditions, investor sentiment, and overall market volatility. As such, this factor is defined by the daily returns of the CF Broad Cap (Free Float Market Cap Weight) Index, offering a comprehensive and capitalization-weighted representation of the asset class.
Size Factor
The size factor captures the return differential associated with asset scale, reflecting the hypothesis that smaller-cap digital assets tend to outperform their larger-cap counterparts. This effect is understood to compensate for elevated operational and financial risks while exploiting potential market inefficiencies. In this framework, the size factor is defined by each asset’s fully diluted market capitalization. The value is sign-inverted so that higher z-scores are assigned to smaller assets and vice-versa.
Value Factor
The value factor reflects a protocol’s ability to generate economic output relative to its capital base and market valuation, combining measures of both efficiency and user engagement. It is constructed as the average z-score of two key ratios: transaction fees relative to total value locked (Fees/TVL) and daily active users relative to market capitalization (DAU/MCap). This composite metric captures how productively a protocol utilizes its resources while also serving as a proxy for user-driven demand. A higher combined score indicates efficient resource utilization and strong user engagement.
Momentum Factor
The momentum factor captures short-term price persistence by identifying assets that have recently exhibited strong performance. It is computed as the average z-score of two metrics: the 2 weeks cumulative performance and the 2 weeks risk-adjusted cumulative performance. This approach aligns with established findings in traditional financial literature and demonstrates empirical relevance in digital assets, where price trends tend to exhibit momentum over short horizons.
Growth Factor
The growth factor captures the expansion of a protocol’s network activity and user adoption. In the context of digital assets, it reflects metrics such as fee generation and user engagement, which serve as indicators of increased platform utilization and operational scale. The factor is defined as the average z-score of 30-day fee growth and 30-day weekly active user growth, thereby identifying assets exhibiting consistent and measurable increases in underlying network usage.
Downside Beta
The downside beta factor captures an asset’s sensitivity to adverse market conditions by isolating its behavior during periods of negative market returns. Empirical evidence shows that assets with lower downside beta tend to outperform their higher-beta counterparts over the long-term, due to their reduced participation in market drawdowns and more stable return profiles during periods of elevated volatility. As such, it is estimated through a regression of the asset’s daily returns over the most recent four-week period against market returns observed exclusively during negative sessions. The resulting value is sign-inverted to ensure that assets with lower downside exposure are assigned higher z-scores.
Liquidity Factor
The liquidity factor captures the ease with which a digital asset can be traded without significantly impacting its price. Empirical evidence shows that illiquid assets tend to command a higher risk premium than their more liquid counterparts, serving as compensation for trading friction and price volatility. To quantify this, the factor is measured using token turnover, defined as trading volume as a percentage of circulating supply. The value is sign-inverted such that higher z-scores are assigned to less liquid assets.
For further detail, view the CF Factors Methodology Document, the CF Factor Data Suite, and Our paper “A Factor Model for Digital Assets” in Springer Nature’s Mathematical Research for Blockchain Economy
The information contained within is for educational and informational purposes ONLY. It is not intended nor should it be considered an invitation or inducement to buy or sell any of the underlying instruments cited including but not limited to cryptoassets, financial instruments or any instruments that reference any index provided by CF Benchmarks Ltd. This communication is not intended to persuade or incite you to buy or sell security or securities noted within. Any commentary provided is the opinion of the author and should not be considered a personalised recommendation. Please contact your financial adviser or professional before making an investment decision.
Note: Some of the underlying instruments cited within this material may be restricted to certain customer categories in certain jurisdictions.
Changes to the Token Market Price Benchmarks Series - Market Prices – 21 July 2026
The Administrator has confirmed changes to the Token Market Price Family for the period 14 July 2026 to 21 July 2026.

CF Benchmarks
Softer CPI Reprices July Hike Risk & Lifts Digital Assets
Digital assets extended their recovery over the past week as cooler US inflation prints repriced Fed expectations; the bid was broad across the large cap indices, growth factor leadership returned, stablecoin funding repriced lower, and stress stayed isolated in names hit by token-specific news.
Mark Pilipczuk
Notice of the Demising of CF Dai-Dollar Settlement Price and Spot Rate
The Administrator announces that it will demise the CF Dai-Dollar Settlement Price (DAIUSD_RR) and CF Dai-Dollar Spot Rate (DAIUSD_RTI) which are members of the CF Digital Asset Index Family.
CF Benchmarks
By clicking Accept, you consent to CF Benchmarks's use of cookies.
Visit Cookie Settings to learn how CF Benchmarks uses cookies and to adjust your preferences.