
Mar 14, 2026
Factor Friday - March 13, 2026
Growth Takes the Lead as the Factor Rotation Continues
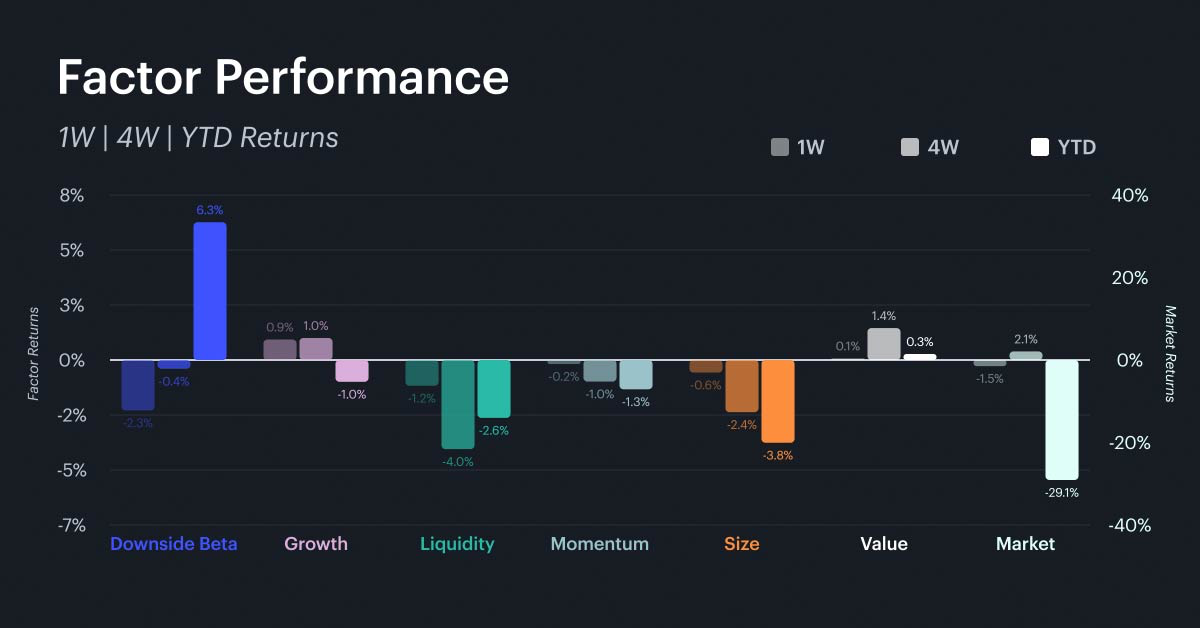
The market lost 1.9% over the last week, extending the year-to-date loss to -29.1%. The more consequential story continues to play out in the factor rankings. Growth led all factors over the trailing seven days at +0.9%, marking the first week this year that it has topped the weekly standings. Value posted another strong week at +1.4% and remains the only factor other than downside beta in positive territory year to date at +0.3%. Downside beta, which dominated the first two months of the year, continued to fade, falling 2.3% on the week and 0.4% over the trailing four weeks, pulling its year-to-date performance down to +6.3% from +8.8% just one week ago. Size and liquidity remain the largest laggards, down -3.8% and -4.0% on the year respectively. The back-to-back weekly leadership of value and growth is the most sustained rotation towards fundamentals since the sell-off began in October.
Rolling Factor Rankings and Rotation
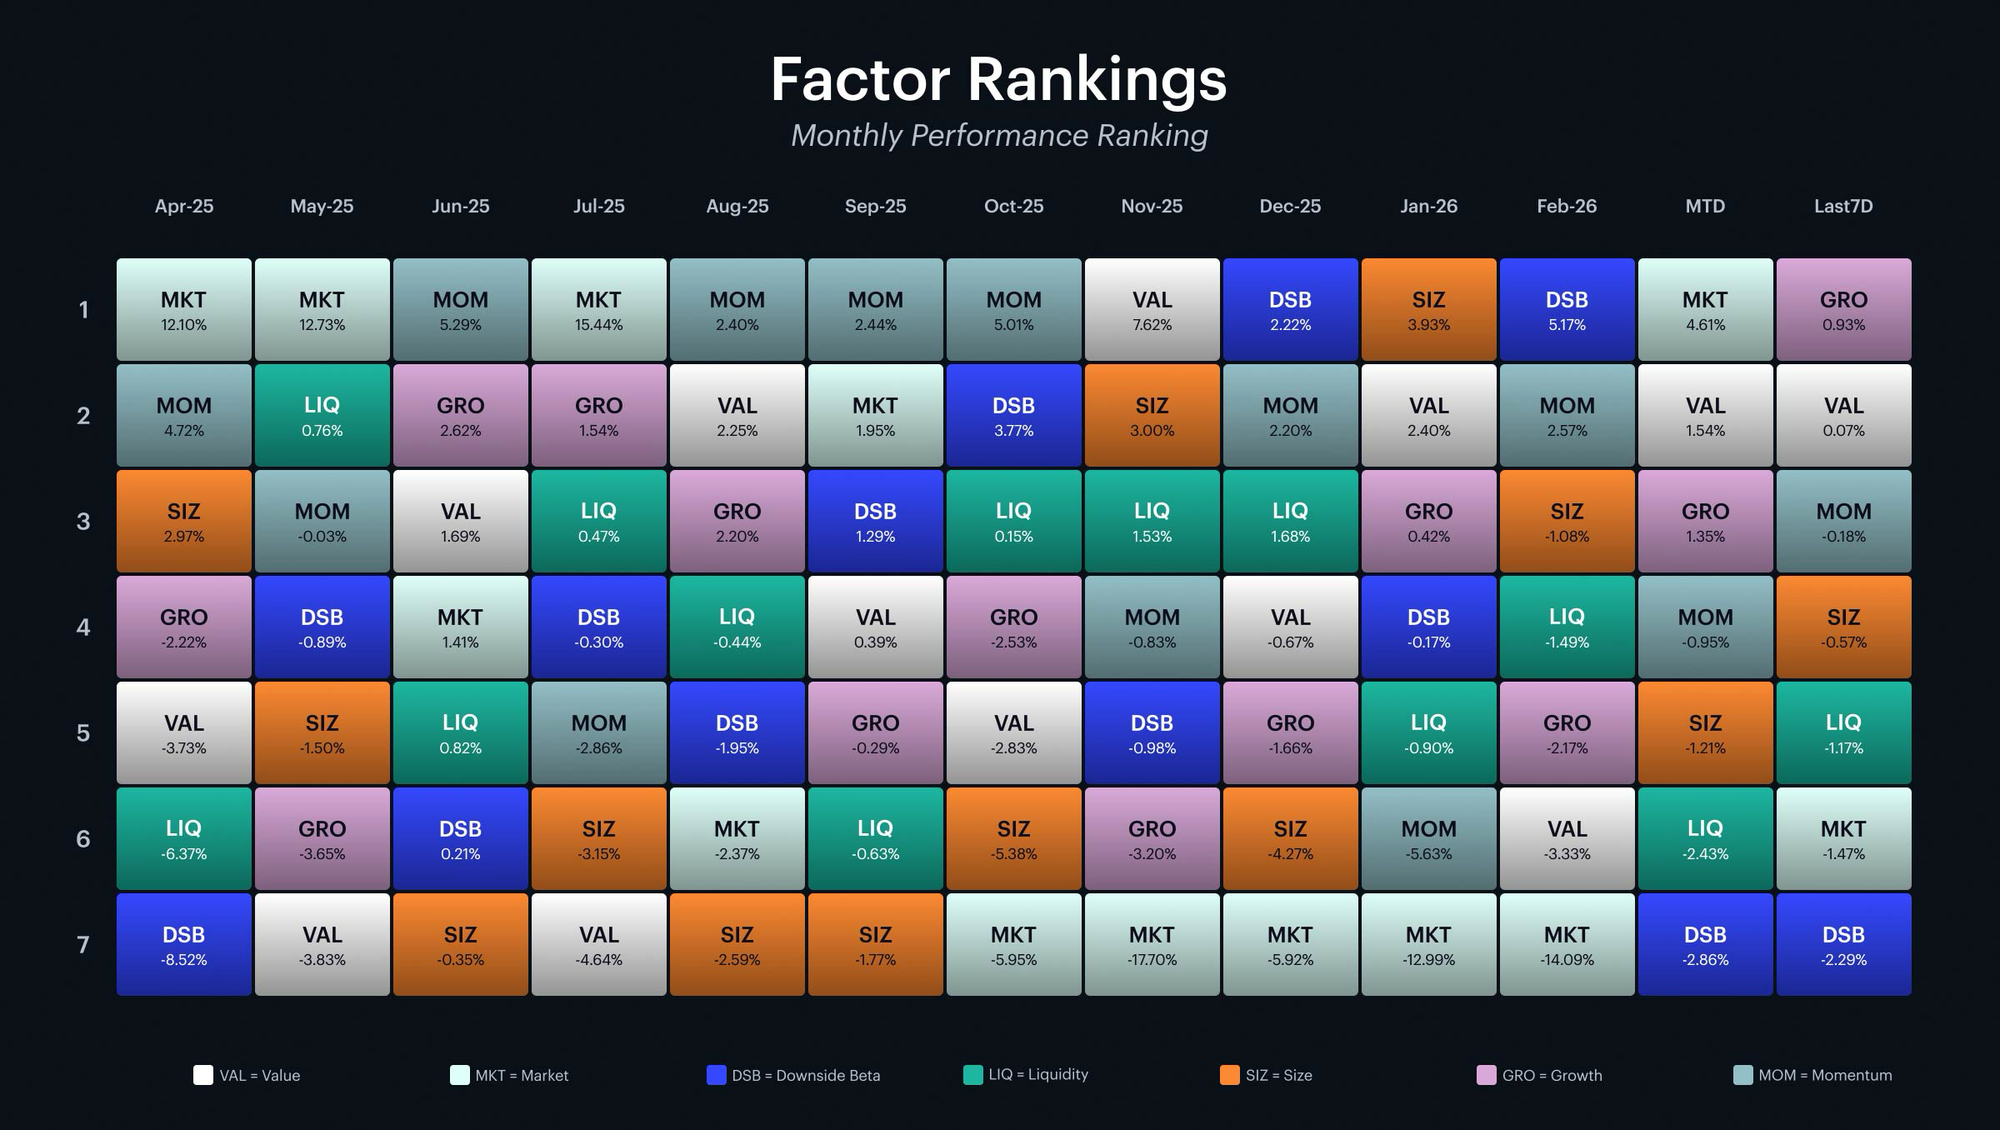
The quilt now shows a clear two-week pattern of rotation. Growth has moved to first place over the trailing seven days, with value in second. The market factor leads the month-to-date rankings for the second consecutive week, with value again in second. Downside beta, which held the top spot from December through early March, has now slipped to the bottom of the weekly rankings, a position it has not occupied since April of last year. Two consecutive weeks of value and growth leading the short-term rankings, combined with downside beta's deterioration in March, suggest that the market is beginning to reward on-chain activity and network growth over purely defensive tokens. Investors who have been positioned exclusively for downside protection should begin evaluating whether a partial rotation toward value and growth exposure is warranted. The test for this regime shift will come if the market experiences another leg lower. If value and growth hold up better than they did during the February drawdown, the rotation will have genuine structural support.
Market and Key Factor Betas
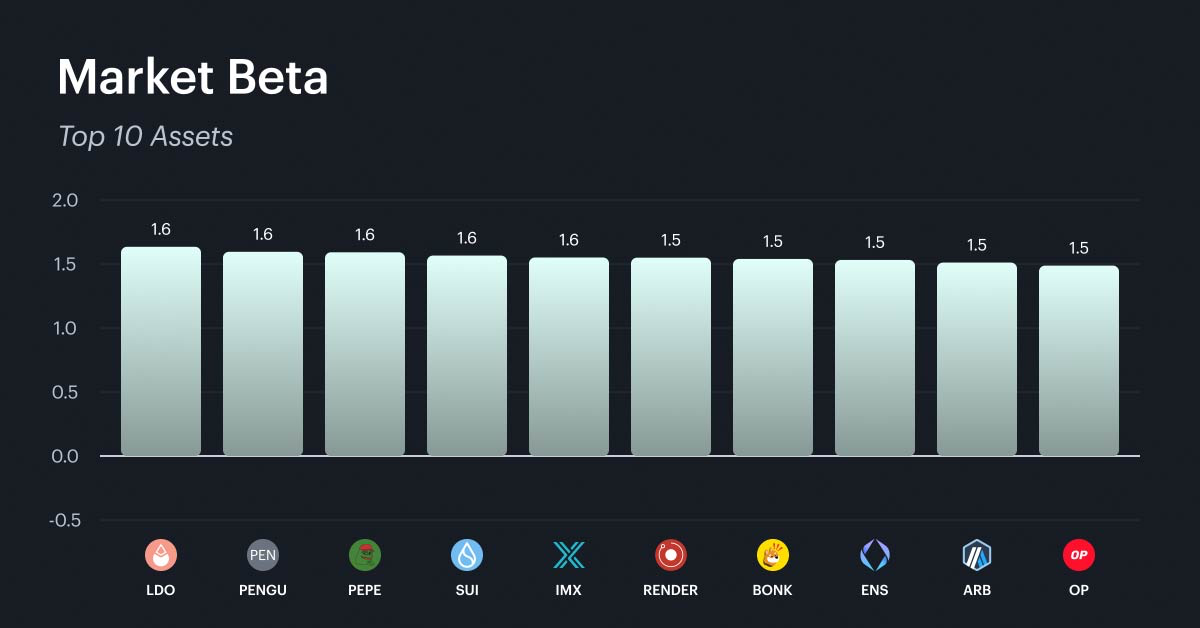
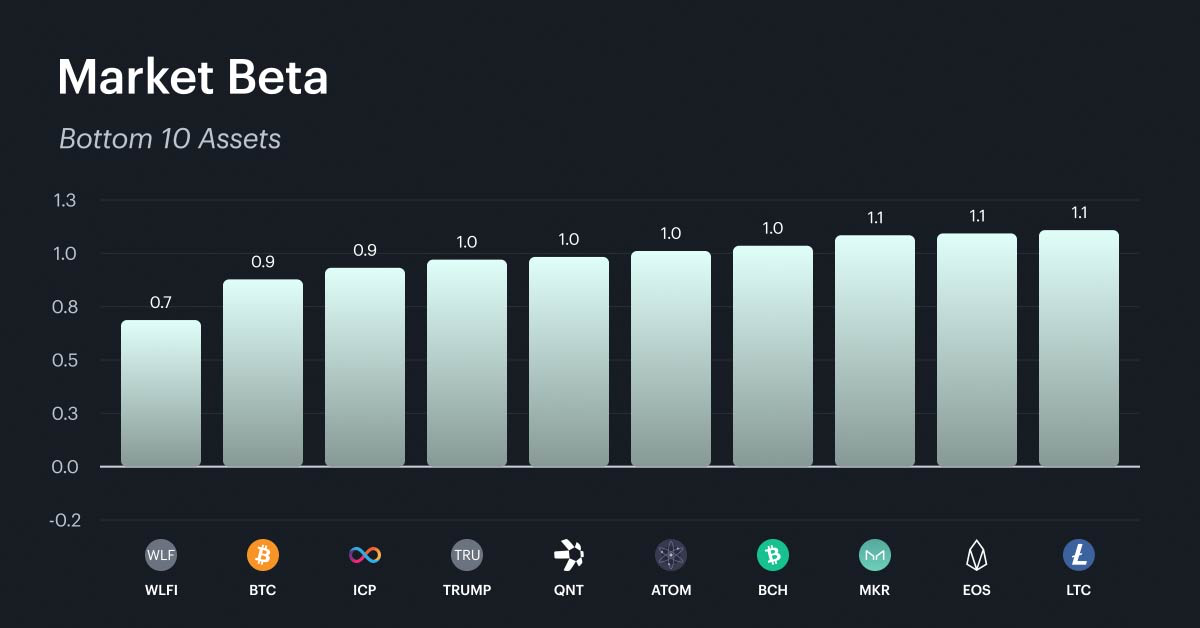
Market Beta
The composition of the market beta rankings remains largely stable from the prior week. The high-beta cohort continues to be dominated by meme coins, newer layer-1 and layer-2 platforms, and DeFi infrastructure tokens, all clustered between 1.5 and 1.6. The low-beta end remains anchored by governance tokens, established store-of-value assets, and infrastructure-layer protocols, with BTC at 0.9 continuing to serve as the most structurally stable asset in the index. The lack of meaningful change in the market beta rankings is itself informative: despite two weeks of factor rotation toward value and growth, the directional risk profile of the index has not shifted. High-beta names still carry the same amplified exposure to market moves, and in a market that remains down 29% year to date, the risk-reward of holding concentrated high-beta positions has not improved. Investors adding exposure to value or growth themes should still screen for market beta, favoring names where fundamental improvement is paired with more moderate directional sensitivity.
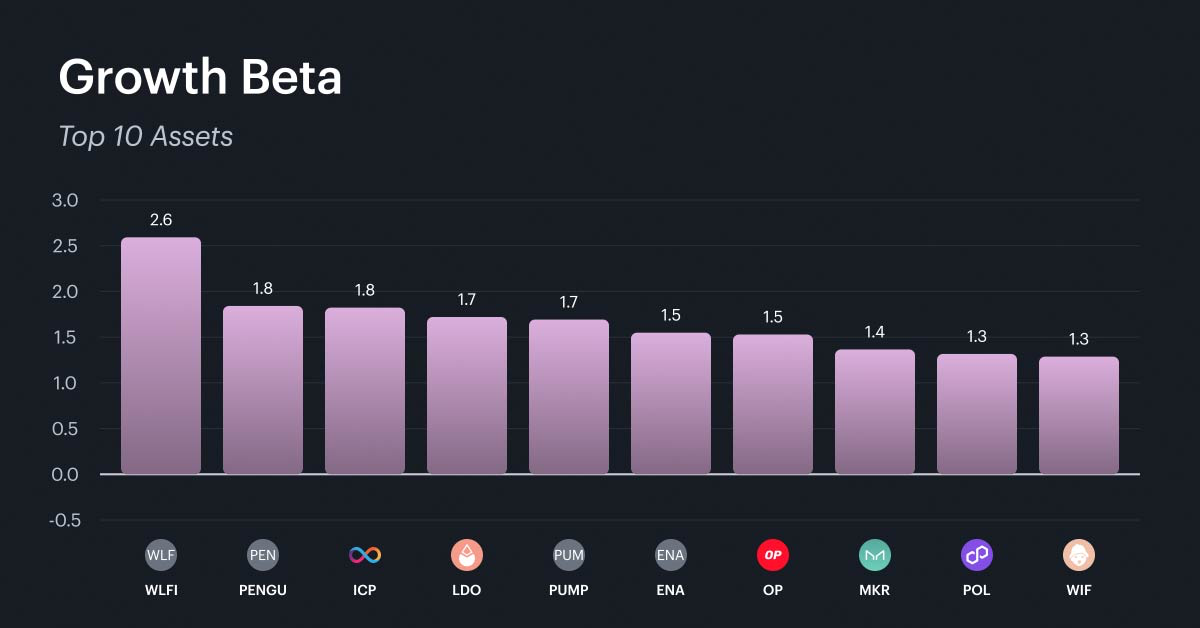
Growth
The growth beta top 10 remains largely unchanged from last week, indicating that a consistent set of market segments are tracking the growth factor. The top of the rankings is populated by newly listed protocols and DeFi-adjacent tokens experiencing rapid early-stage user adoption and fee growth. Mid-tier growth beta is concentrated in established layer-2 scaling solutions and governance platforms that are seeing renewed network activity. The stability of the growth rankings over two consecutive weeks, combined with the factor's move to first place in the weekly standings, gives investors more confidence that the growth outperformance may be durable. However, many of the highest-growth tokens also sit in the top half of the market beta rankings, meaning the growth trade carries embedded directional risk.
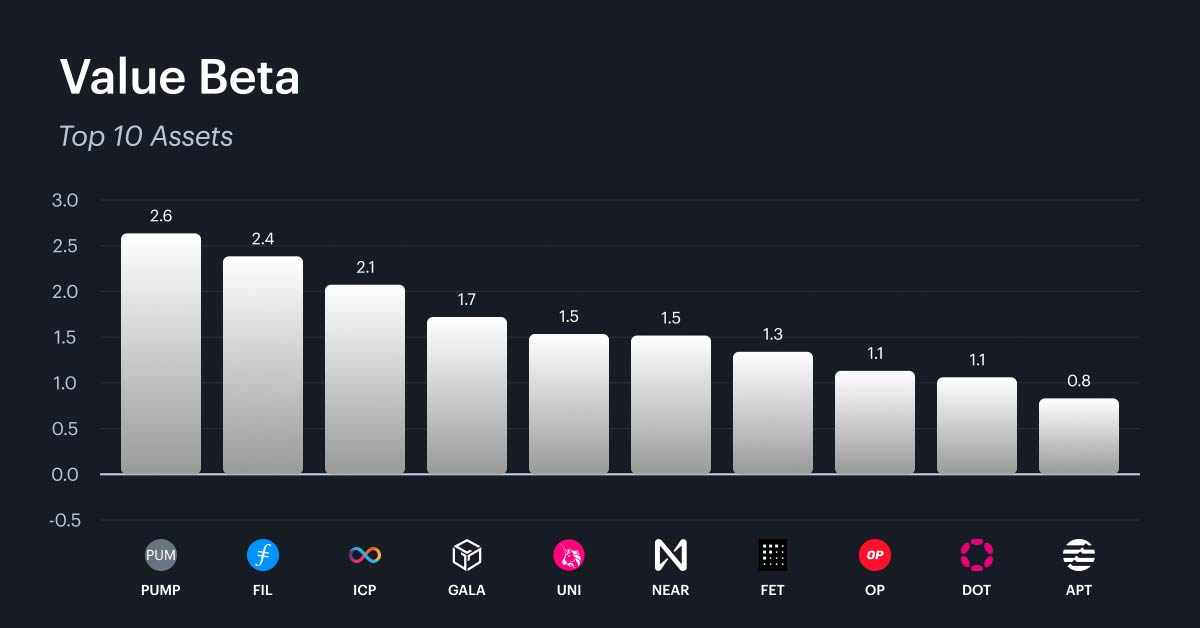
Value
The value beta top 10 is also highly consistent with the prior week, with the same mix of fee-generating infrastructure protocols, decentralized exchanges, and data-layer networks occupying the highest scores. These are tokens where on-chain productivity, strong fee revenue relative to capital base and active user engagement, is being recognized by the market. The persistence of value at or above zero year to date, now in its second consecutive week, is a meaningful departure from the sustained underperformance it showed through January and most of February. For investors, the actionable takeaway is that protocols demonstrating real economic output are beginning to be re-rated by the market.. Allocating toward mid-cap tokens with strong on-chain fundamentals, particularly those that also rank in the lower half of market beta, offers the best risk-adjusted way to express a value tilt without taking on excessive directional exposure.
What Factors are Driving Markets
The Sectors contribution chart highlights a notable disconnect. While the index performance line has recovered toward flat over the most recent sessions, the underlying factor contributions have been persistently negative through the majority of the trailing 30-day window. Downside beta, size, and liquidity have been the primary detractors, with growth only recently beginning to contribute positively. The result is that the cumulative factor drag over the period remains negative even as the index itself has recovered. This means the rebound in the Sectors index has been driven largely by idiosyncratic moves and residual returns outside the factor model, rather than by a broad improvement in measured risk factors. Investors should interpret this carefully: the recovery in Sectors is not yet supported by a fundamental factor tailwind, and a pullback in the broad market could leave the index vulnerable without factor-based support.
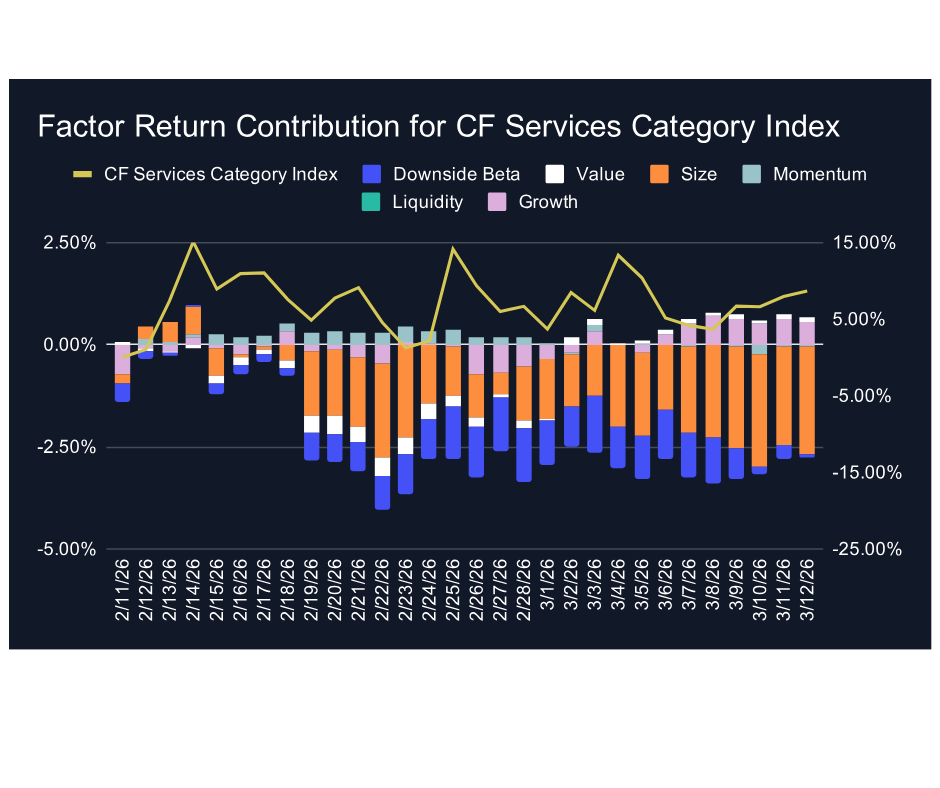
The Services index shows a similar and arguably more pronounced version of this dynamic. The index performance line has turned positive in recent sessions, but the stacked factor contribution bars remain cumulatively negative. Size and downside beta have been the largest headwinds, with growth only recently shifting to a marginal positive contribution in the most recent days. The gap between the positive index line and the negative factor bars tells a clear story: the rally in Services is running ahead of the factor fundamentals. In practical terms, select service-layer tokens are being bid up on sentiment or flows rather than on a broad improvement across the measured risk factors. This creates a fragile setup, if factor contributions do not turn positive to validate the rally the index is likely to give back recent gains. Investors adding Services exposure at current levels should be aware they are effectively betting on a continued recovery in the broader market.
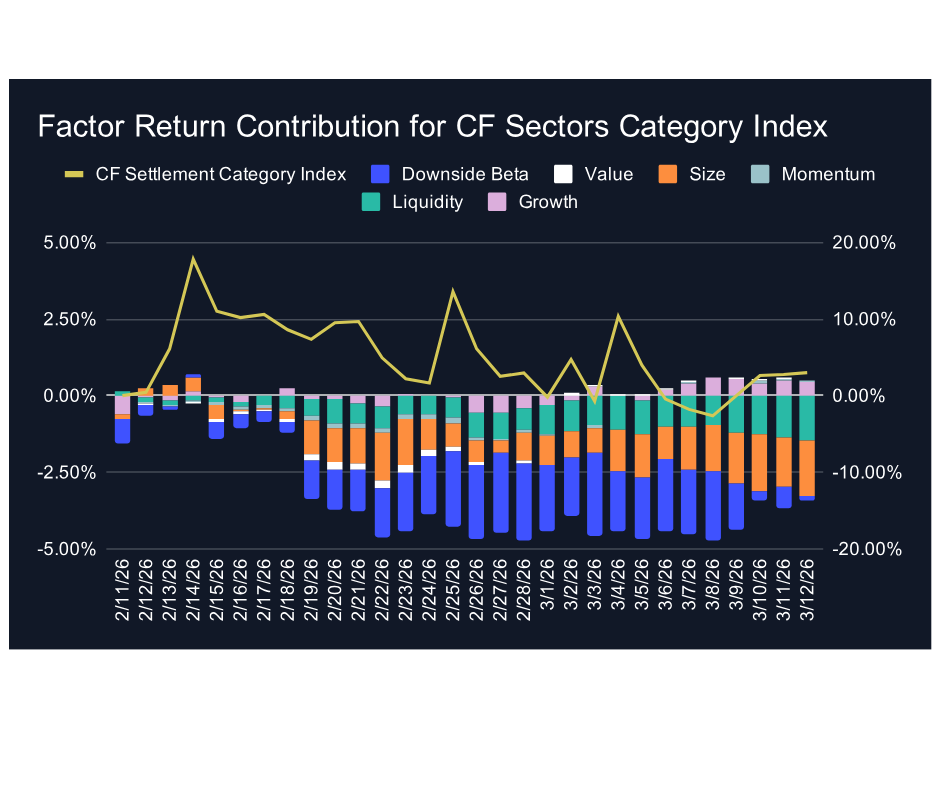
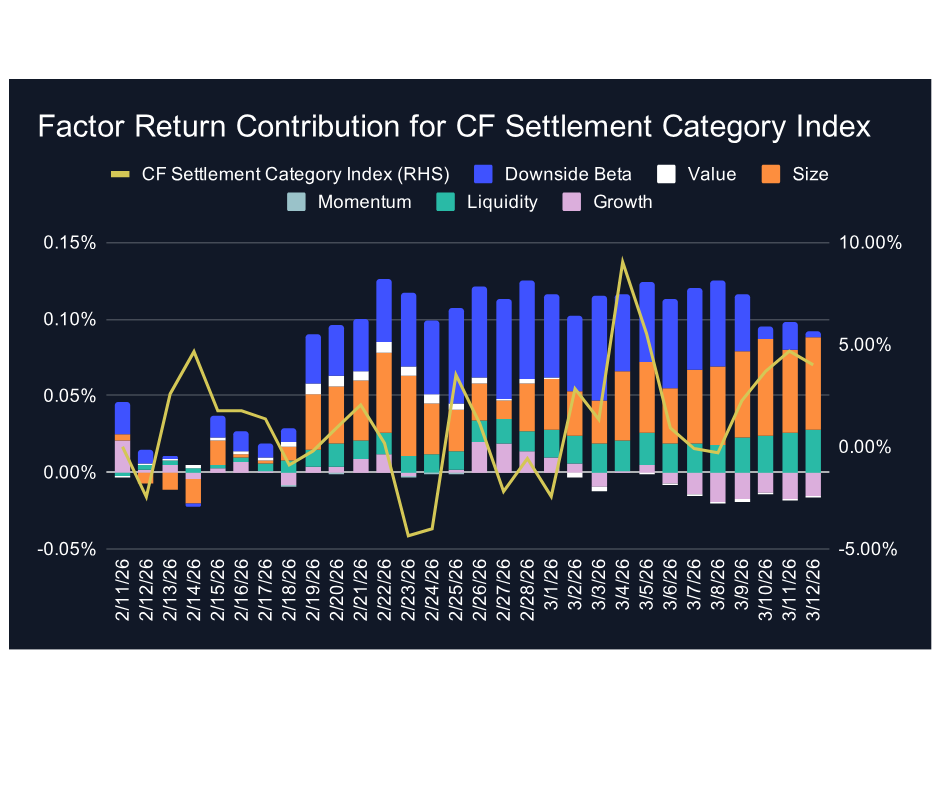
The Settlement index is the most internally consistent of the three categories. Factor contributions have been positive throughout the period, led by downside beta and supported by size and growth. The index performance line has oscillated but remains in positive territory over recent sessions. Unlike Sectors and Services, where the index recovery has outpaced the factor contributions, Settlement's performance is well-supported by the underlying factor dynamics. This compositional advantage continues to be driven by the concentration of large-cap blue-chip tokens in the category, which benefit from both lower market beta and positive downside beta contributions. For investors navigating the current environment, Settlement remains the most defensible category allocation, offering factor-supported returns rather than the sentiment-driven recoveries visible elsewhere.
Appendix: CF Factor Methodology
Market Factor
The market factor captures the broad, systematic risk that permeates the digital asset ecosystem. It reflects aggregate influences such as macroeconomic conditions, investor sentiment, and overall market volatility. As such, this factor is defined by the daily returns of the CF Broad Cap (Free Float Market Cap Weight) Index, offering a comprehensive and capitalization-weighted representation of the asset class.
Size Factor
The size factor captures the return differential associated with asset scale, reflecting the hypothesis that smaller-cap digital assets tend to outperform their larger-cap counterparts. This effect is understood to compensate for elevated operational and financial risks while exploiting potential market inefficiencies. In this framework, the size factor is defined by each asset’s fully diluted market capitalization. The value is sign-inverted so that higher z-scores are assigned to smaller assets and vice-versa.
Value Factor
The value factor reflects a protocol’s ability to generate economic output relative to its capital base and market valuation, combining measures of both efficiency and user engagement. It is constructed as the average z-score of two key ratios: transaction fees relative to total value locked (Fees/TVL) and daily active users relative to market capitalization (DAU/MCap). This composite metric captures how productively a protocol utilizes its resources while also serving as a proxy for user-driven demand. A higher combined score indicates efficient resource utilization and strong user engagement.
Momentum Factor
The momentum factor captures short-term price persistence by identifying assets that have recently exhibited strong performance. It is computed as the average z-score of two metrics: the 2 weeks cumulative performance and the 2 weeks risk-adjusted cumulative performance. This approach aligns with established findings in traditional financial literature and demonstrates empirical relevance in digital assets, where price trends tend to exhibit momentum over short horizons.
Growth Factor
The growth factor captures the expansion of a protocol’s network activity and user adoption. In the context of digital assets, it reflects metrics such as fee generation and user engagement, which serve as indicators of increased platform utilization and operational scale. The factor is defined as the average z-score of 30-day fee growth and 30-day weekly active user growth, thereby identifying assets exhibiting consistent and measurable increases in underlying network usage.
Downside Beta
The downside beta factor captures an asset’s sensitivity to adverse market conditions by isolating its behavior during periods of negative market returns. Empirical evidence shows that assets with lower downside beta tend to outperform their higher-beta counterparts over the long-term, due to their reduced participation in market drawdowns and more stable return profiles during periods of elevated volatility. As such, it is estimated through a regression of the asset’s daily returns over the most recent four-week period against market returns observed exclusively during negative sessions. The resulting value is sign-inverted to ensure that assets with lower downside exposure are assigned higher z-scores.
Liquidity Factor
The liquidity factor captures the ease with which a digital asset can be traded without significantly impacting its price. Empirical evidence shows that illiquid assets tend to command a higher risk premium than their more liquid counterparts, serving as compensation for trading friction and price volatility. To quantify this, the factor is measured using token turnover, defined as trading volume as a percentage of circulating supply. The value is sign-inverted such that higher z-scores are assigned to less liquid assets.
For further detail, view the CF Factors Methodology Document, the CF Factor Data Suite, and Our paper “A Factor Model for Digital Assets” in Springer Nature’s Mathematical Research for Blockchain Economy
The information contained within is for educational and informational purposes ONLY. It is not intended nor should it be considered an invitation or inducement to buy or sell any of the underlying instruments cited including but not limited to cryptoassets, financial instruments or any instruments that reference any index provided by CF Benchmarks Ltd. This communication is not intended to persuade or incite you to buy or sell security or securities noted within. Any commentary provided is the opinion of the author and should not be considered a personalised recommendation. Please contact your financial adviser or professional before making an investment decision.
Note: Some of the underlying instruments cited within this material may be restricted to certain customer categories in certain jurisdictions.
Factor Friday - July 10, 2026
The relief rally extended for a second week with Market +2.27%, but the real story is risk appetite: Liquidity led styles at +1.51% as thinner, less liquid names caught a bid. Value paused at -0.79% yet still leads over four weeks. Defensive tilts kept unwinding into the bounce.

Mark Pilipczuk
2026 Mid-Year Market Outlook
Iran risk, regulatory policy, Bitcoin rebalancing, tokenization, and protocol revenue are reshaping the outlook. Growth is narrowing, but regulatory progress and productive on-chain activity create offsets. Dispersion, not broad beta, should define the next year.
Gabriel Selby
Changes to the Token Market Price Benchmarks Series - Market Prices – 07 July 2026
The Administrator has confirmed changes to the Token Market Price Family for the period 30 June 2026 to 07 July 2026.
CF Benchmarks
By clicking Accept, you consent to CF Benchmarks's use of cookies.
Visit Cookie Settings to learn how CF Benchmarks uses cookies and to adjust your preferences.