
Apr 10, 2026
Factor Friday - April 10, 2026
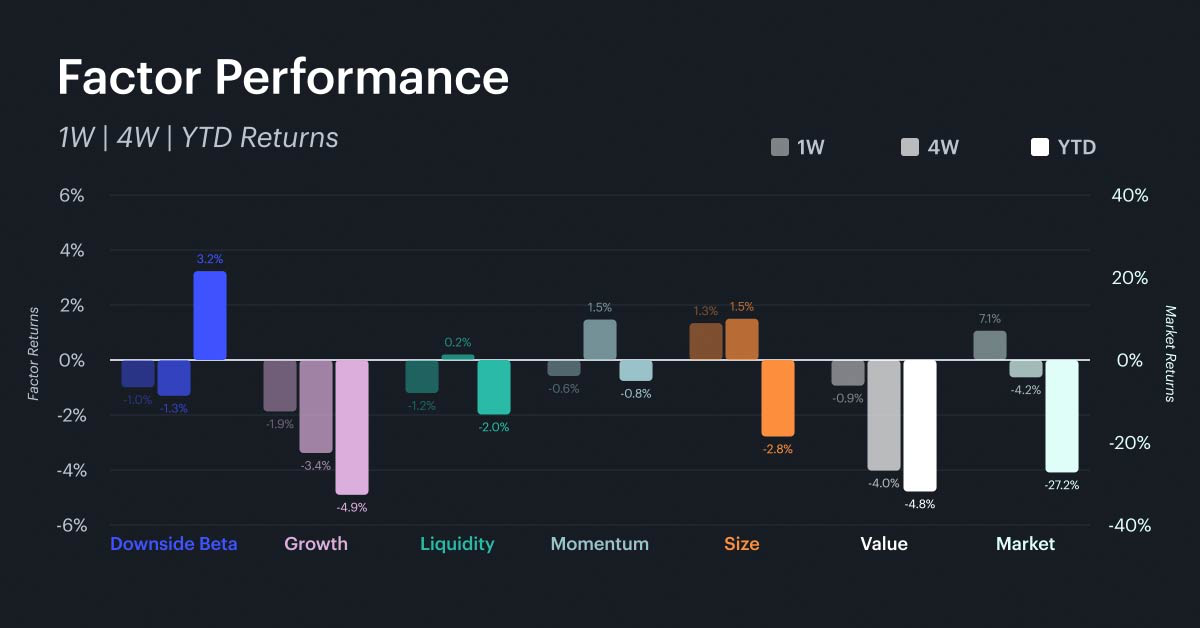
Market Surges 7.1% but Factor Breadth Remains Narrow
The market posted its strongest weekly gain of 2026 at +7.1%, narrowing the year-to-date loss to -27.3%. Despite the sharp rally, factor breadth was notably thin. Size was the only non-market factor to post a positive weekly return at +1.3%, while every other factor finished in the red. Growth was the weakest at -1.9%, followed by liquidity at -1.2%, downside beta at -1.0%, value at -0.9%, and momentum at -0.6%. On a four-week basis, the picture is similarly concentrated: the market factor leads alongside size at +1.5% and momentum at +1.5%, while value remains the deepest laggard at -4.0% over four weeks and -4.8% year to date. The disconnect between the market's strong weekly performance and the uniformly negative factor returns is the key takeaway this week. It means the rally was driven almost entirely by broad directional buying rather than any specific factor.
Rolling Factor Rankings and Rotation
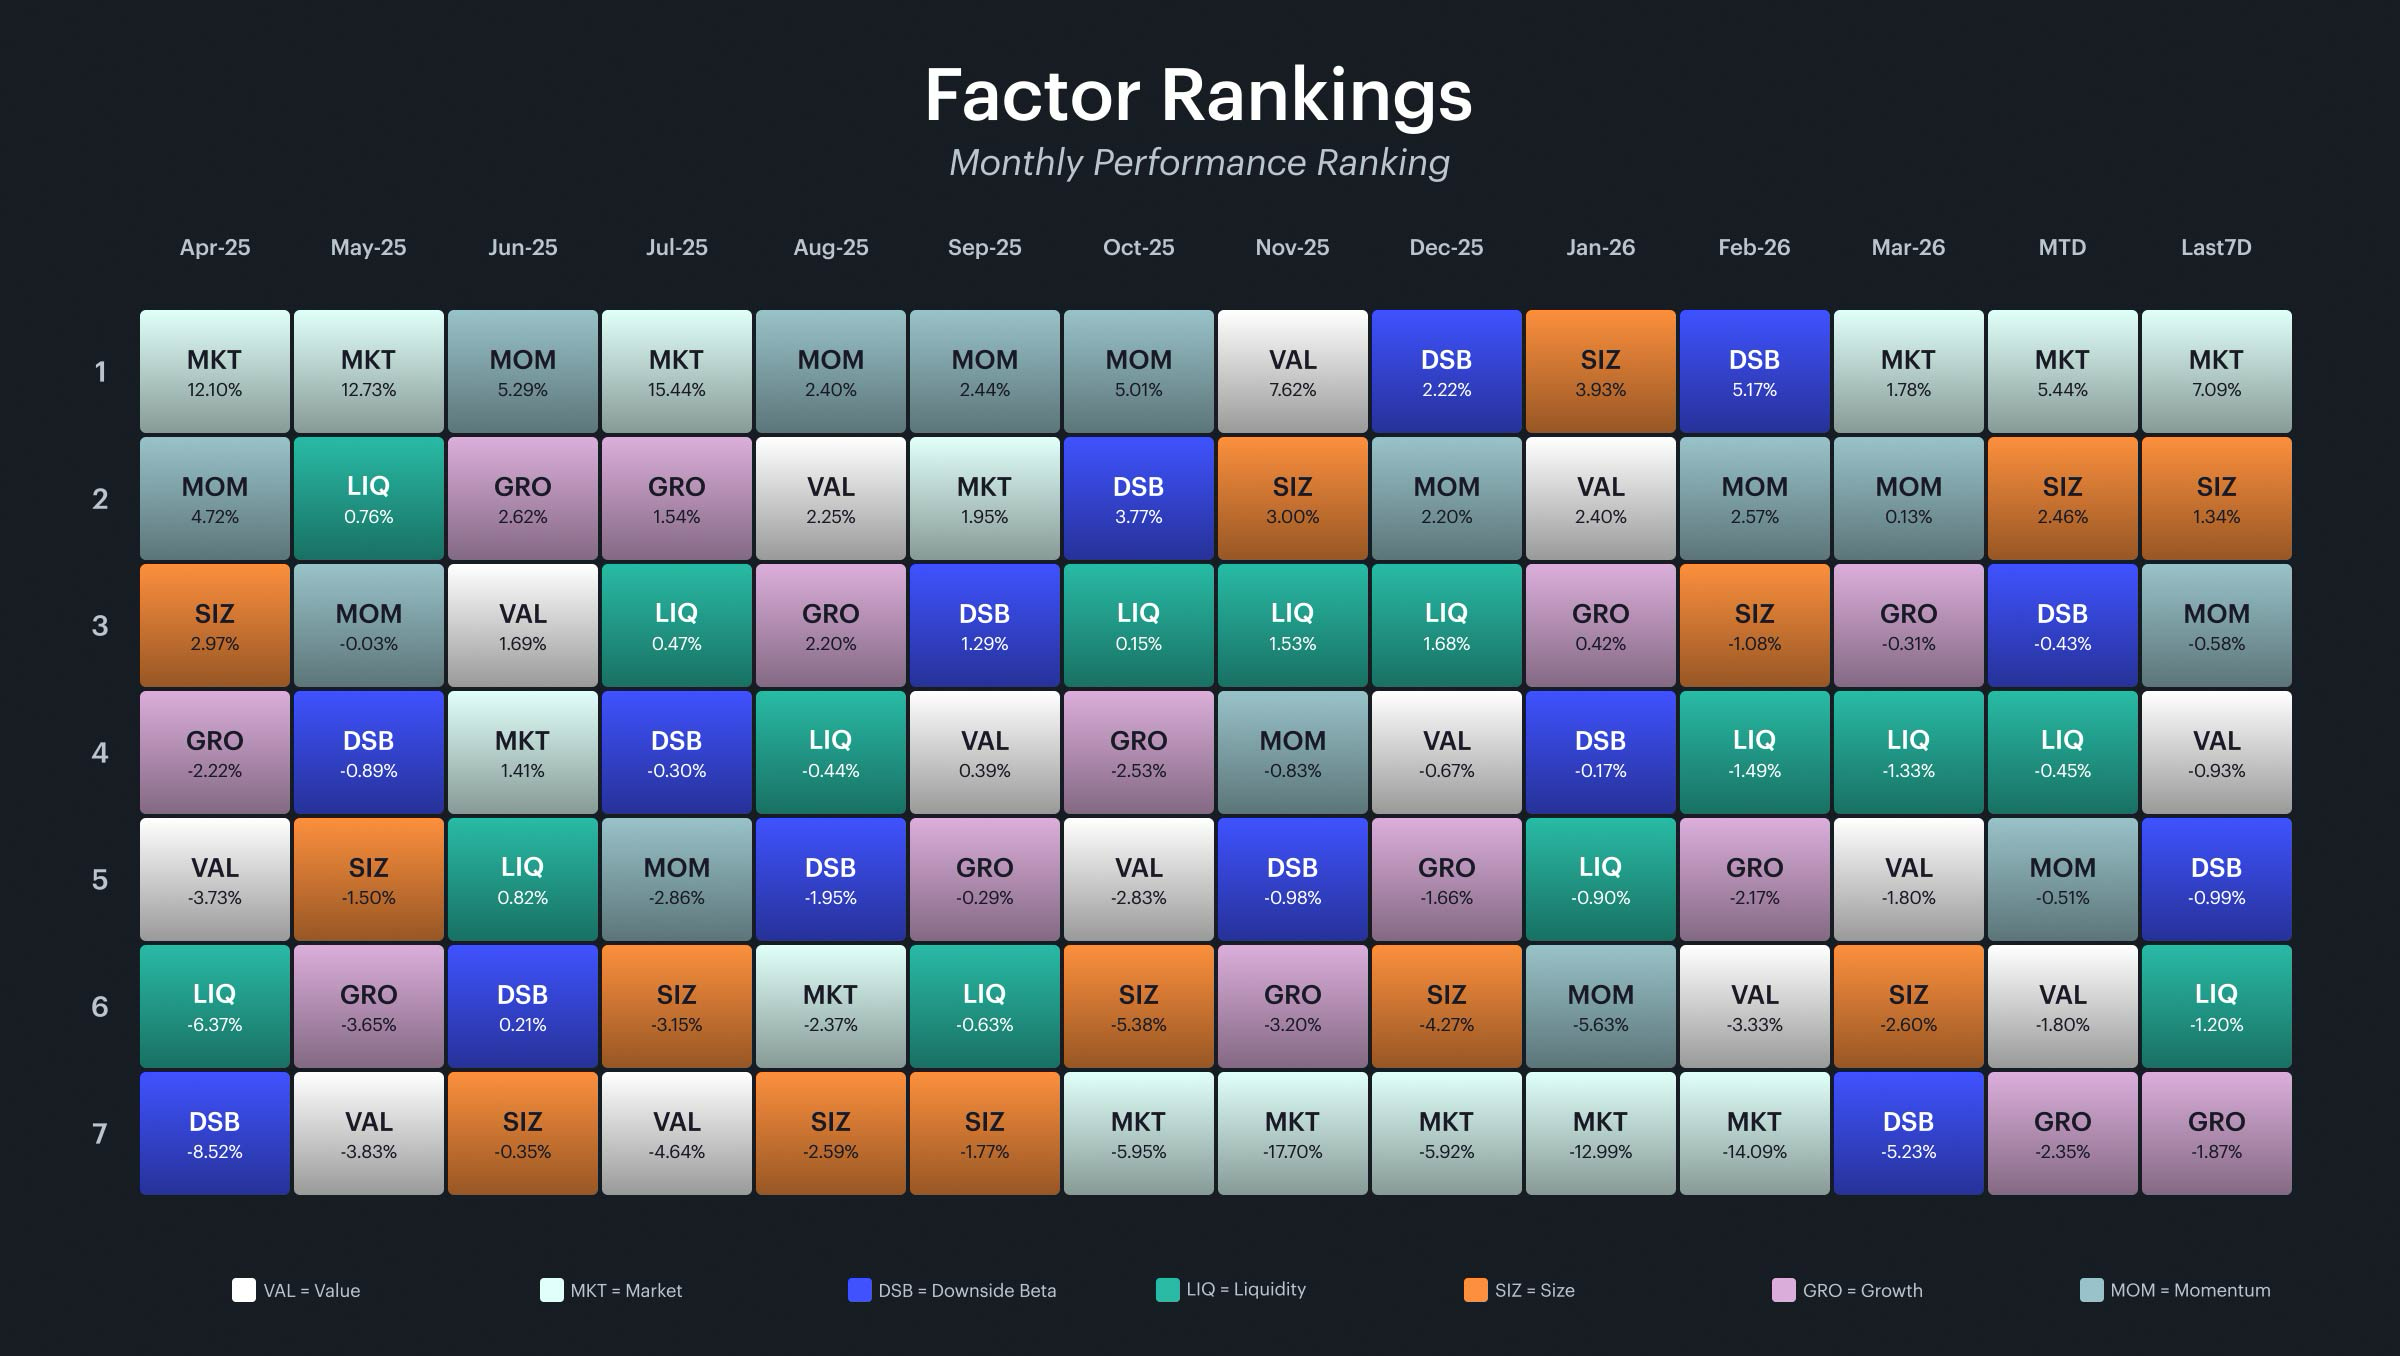
The quilt chart this week is dominated by the market factor, which sits at the top of both the weekly rankings at +7.1% and the month-to-date standings at +5.4%. Size is the clear second at +1.3% on the week and +2.5% month to date, reinforcing its emergence as a persistent theme since early April. The remaining factors are clustered in negative territory on the week: momentum at -0.6%, value at -0.9%, downside beta at -1.0%, liquidity at -1.2%, and growth at -1.9%. The month-to-date rankings tell a similar story, with downside beta, liquidity, and momentum tightly grouped between -0.4% and -0.5%, and value and growth lagging at -1.8% and -2.4% respectively. Looking at the broader arc, the rotation that cycled through every factor over the past six weeks has paused. The market factor's dominance this week, combined with the absence of any other factor posting a meaningful positive return, suggests a shift from factor-driven rotation to a more directional, beta-driven rally. For investors, this is a mixed signal. The market's strong week is welcome after a -32% drawdown, but the lack of factor confirmation means the rally may be more fragile than the headline number suggests.
Market and Key Factor Betas
Market Beta
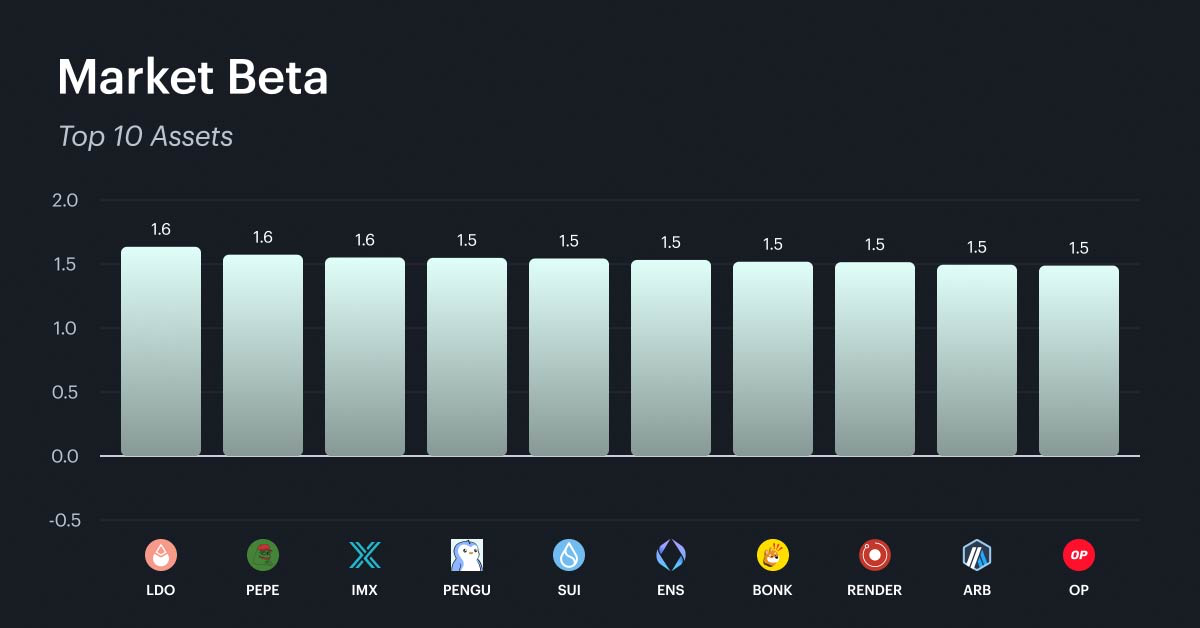
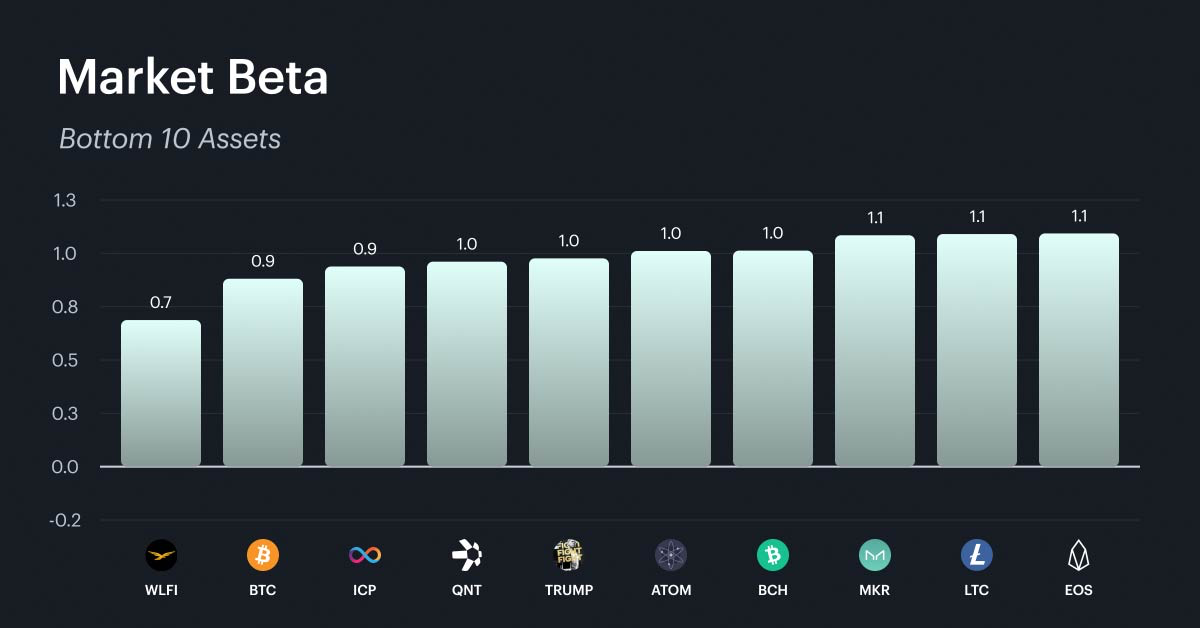
The market beta rankings remain stable for the seventh consecutive week. The high-beta cohort continues to cluster between 1.5 and 1.6, dominated by meme coins, newer layer-1 and layer-2 platforms, and DeFi infrastructure tokens. The low-beta end is anchored by governance tokens, BTC at 0.9, and a group of established protocols at or near 1.0. In a week where the market surged +7.1%, the high-beta names at the top of this list outperformed dramatically. Seven weeks of stability in these rankings now provides a reliable map of directional exposure across the asset class. For investors participating in the rally, the high-beta cohort offered the most amplified upside this week, but the same amplification will apply in reverse if the rally fades.
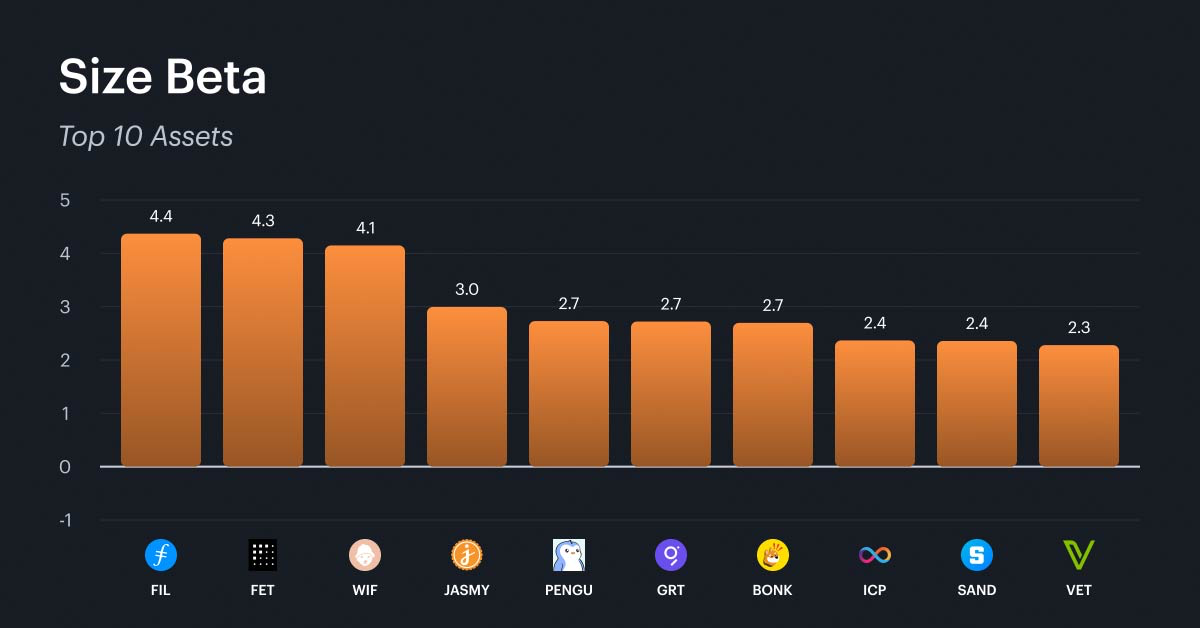
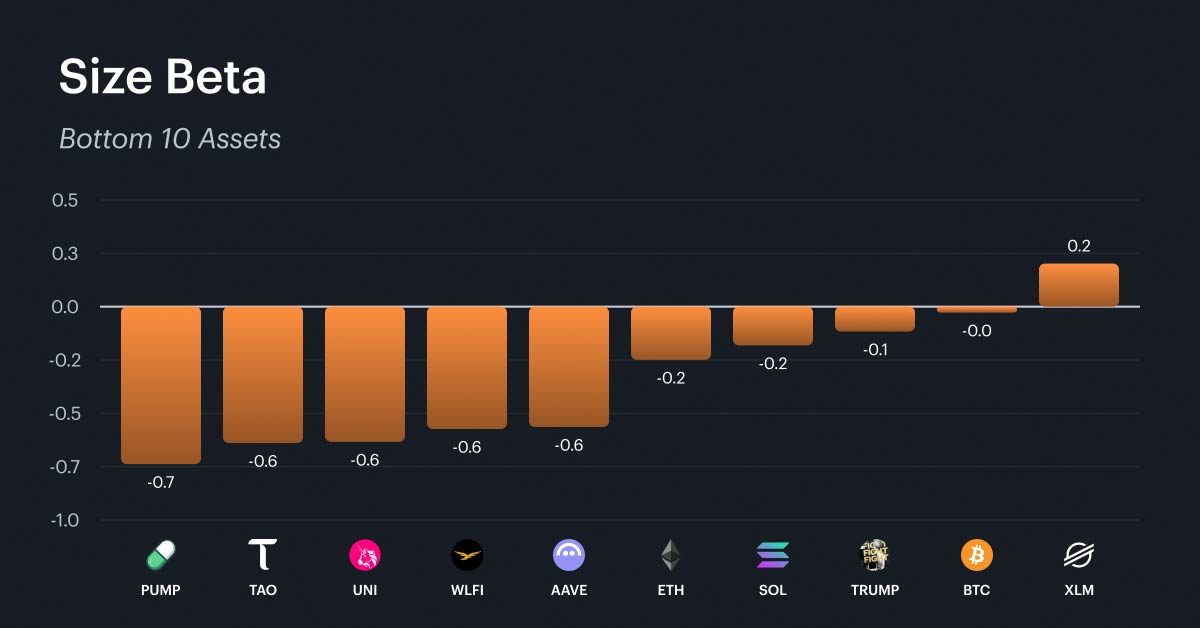
Size
Size's position as the only non-market factor with a positive weekly return makes this beta particularly relevant. The size factor is sign-inverted, so higher scores correspond to smaller-cap assets. The top 10 is dominated by mid-to-small-cap infrastructure tokens, meme coins, and data-oriented protocols. These are the smallest names in the index by fully diluted market capitalization, and their outperformance this week alongside the market's +7.1% surge indicates that the rally was broad enough to lift the smallest segments of the market. The bottom 10 paints the other side of the picture: large-cap blue chips, established DeFi protocols, and governance tokens cluster at the lowest size scores. BTC, ETH, and SOL all appear in this group, confirming that the largest and most established assets carry the least size factor exposure. This week's dynamic was unusual in that both the market factor (+7.1%) and size (+1.3%) were positive simultaneously, meaning the rally favored smaller names even more than the broad market. For investors, this is consistent with a risk-on environment where capital is flowing down the cap spectrum. The month-to-date leadership of size at +2.5% suggests this is not a one-week anomaly but an emerging theme for April.
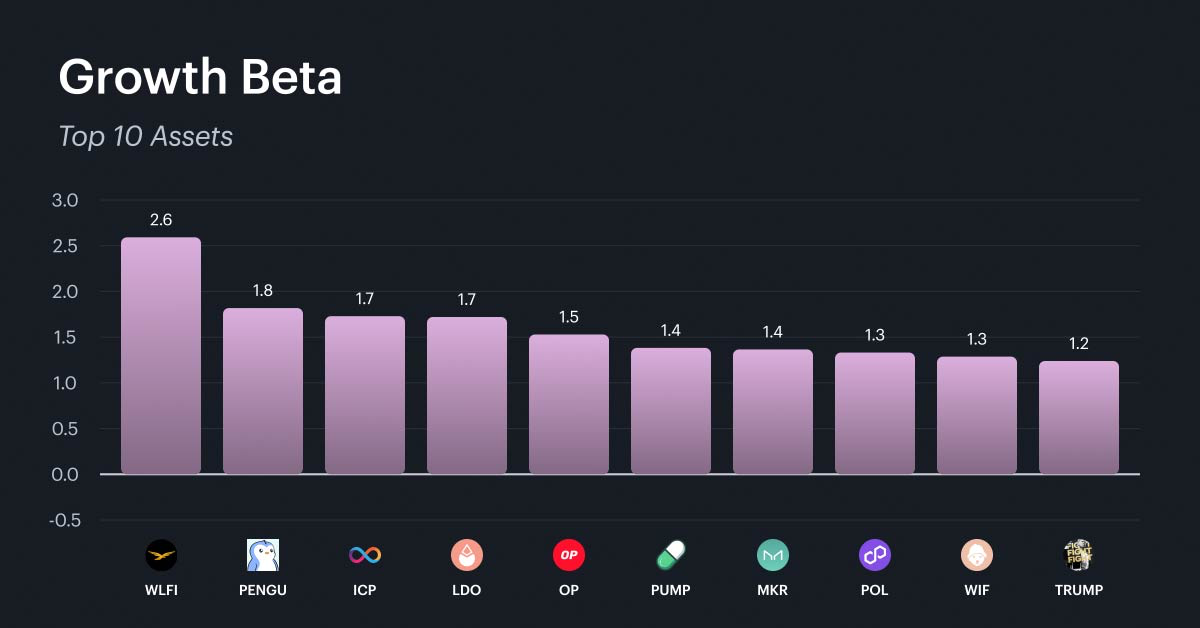
Growth
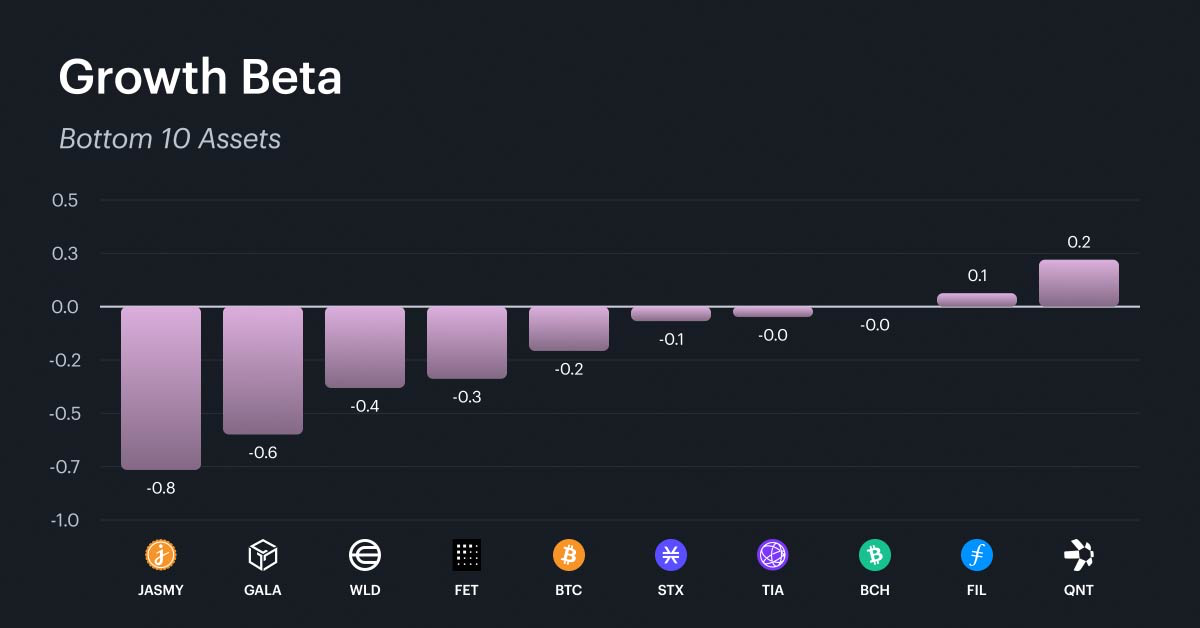
Growth finished last in the weekly rankings at -1.9% and has now declined -3.4% over four weeks, making it the worst-performing factor on both horizons alongside value. The growth factor captures the expansion of a protocol's network activity and user adoption, measured through fee generation growth and weekly active user growth. The top 10 growth betas are concentrated among governance tokens, layer-2 scaling platforms, DeFi protocols, and meme coins with rapidly expanding user bases. The bottom 10 is populated by IoT and data tokens, gaming platforms, established layer-1 infrastructure, and store-of-value protocols The striking takeaway is that in a week where the market surged +7.1%, the assets with the strongest growth profiles underperformed those with the weakest. This is atypical and suggests the rally was driven by broad directional flows rather than a reassessment of protocol fundamentals. For investors, the persistent underperformance of growth alongside value indicates that the market is not currently paying a premium for fundamental quality. Until these factors stabilize, portfolios tilted toward fundamental metrics is likely to continue to lag purely directional exposure.
What Factors are Driving Markets
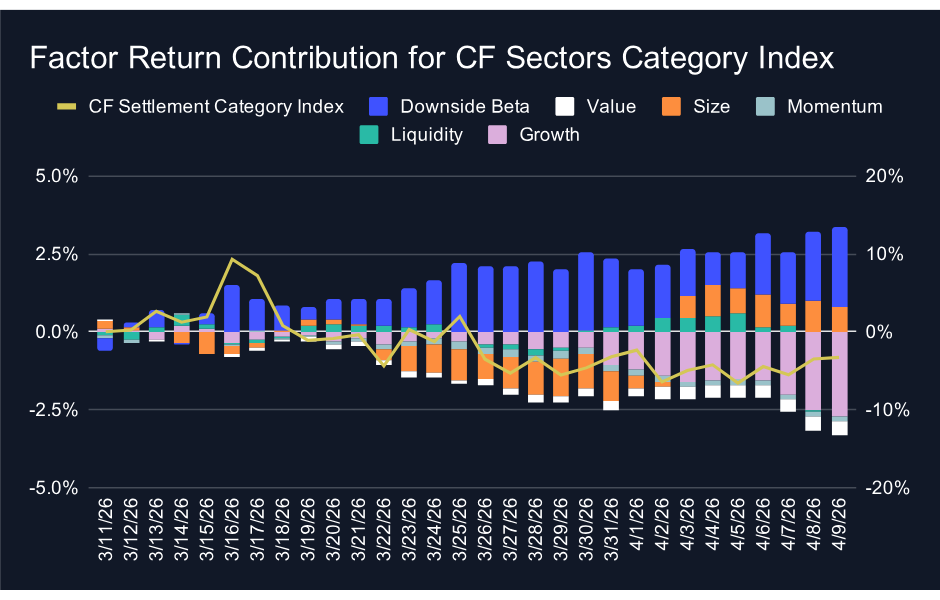
The Sectors category shows cumulative factor contributions that are roughly flat over the trailing 30 days, while the index sits at -3.3%. The roughly 3 percentage point gap means that cumulative factor contributions exceed the index's performance - the factor environment has been neutral, but category-level selling pressure has dragged the index below what the factor model would predict. Downside beta remains the largest positive contributor at +2.6%, but it is almost entirely offset by growth at -2.7% and smaller negative contributions from value and momentum. The net result is a factor picture that provides neither tailwind nor headwind, leaving the index's decline attributable to idiosyncratic effects. For investors in tokens in the Sectors category, the factor model is not the source of underperformance, which means a recovery will depend more on asset-specific catalysts than on a shift in factor dynamics.
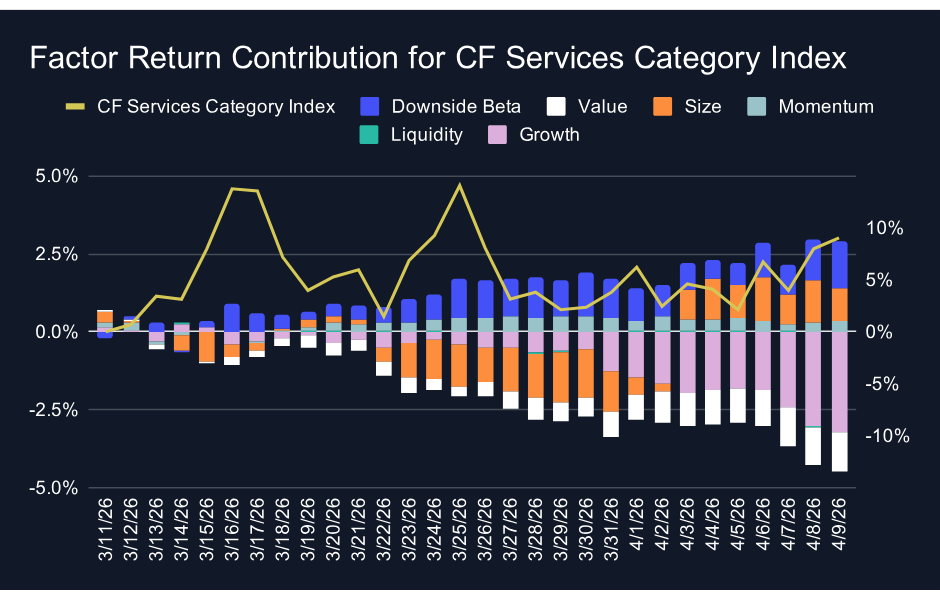
The Services category presents the most significant disconnect of the three this week. Cumulative factor contributions stand at approximately -1.6%, driven by a deeply negative contribution from growth at -3.2% that is partially offset by downside beta at +1.5% and size at +1.1%. Despite this negative factor backdrop, the index has surged to +9.0% over the trailing 30 days. The roughly 10.6 percentage point gap between factor contributions and index performance is the widest of any category and means the index is dramatically outperforming what the factor model would predict. The rally in tokens in the Services category is being driven almost entirely by idiosyncratic flows and sentiment rather than factor contribution. This is a pattern that has recurred throughout the recent period: Services has repeatedly shown index-level performance that diverges from its underlying factor exposure. For investors, the positive index performance is encouraging, but the absence of factor confirmation makes it vulnerable to reversal if sentiment shifts.
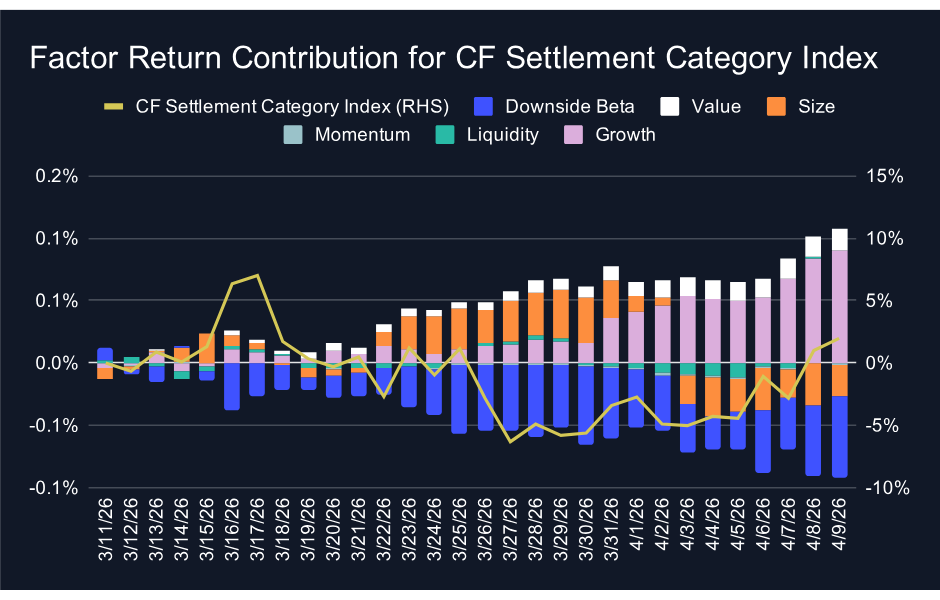
The Settlement category has moved back into positive territory, with the index returning +2.0% over the trailing 30 days. Factor contributions remain effectively flat, with all individual factors near zero, which is consistent with Settlement's heavy concentration in large-cap tokens that carry muted factor exposures. The roughly 2 percentage point gap between flat factor contributions and the positive index return means the recovery in tokens in the Settlement category is directional rather than factor-driven. This is a departure from earlier periods when Settlement benefited from positive factor alignment, particularly from downside beta. The category's performance is now tracking the broad market's directional moves more closely. For investors, Settlement continues to offer the most stable factor profile of the three categories, but its performance advantage is no longer coming from factor differentiation. It is simply moving with the market.
Appendix: CF Factor Methodology
Market Factor
The market factor captures the broad, systematic risk that permeates the digital asset ecosystem. It reflects aggregate influences such as macroeconomic conditions, investor sentiment, and overall market volatility. As such, this factor is defined by the daily returns of the CF Broad Cap (Free Float Market Cap Weight) Index, offering a comprehensive and capitalization-weighted representation of the asset class.
Size Factor
The size factor captures the return differential associated with asset scale, reflecting the hypothesis that smaller-cap digital assets tend to outperform their larger-cap counterparts. This effect is understood to compensate for elevated operational and financial risks while exploiting potential market inefficiencies. In this framework, the size factor is defined by each asset’s fully diluted market capitalization. The value is sign-inverted so that higher z-scores are assigned to smaller assets and vice-versa.
Value Factor
The value factor reflects a protocol’s ability to generate economic output relative to its capital base and market valuation, combining measures of both efficiency and user engagement. It is constructed as the average z-score of two key ratios: transaction fees relative to total value locked (Fees/TVL) and daily active users relative to market capitalization (DAU/MCap). This composite metric captures how productively a protocol utilizes its resources while also serving as a proxy for user-driven demand. A higher combined score indicates efficient resource utilization and strong user engagement.
Momentum Factor
The momentum factor captures short-term price persistence by identifying assets that have recently exhibited strong performance. It is computed as the average z-score of two metrics: the 2 weeks cumulative performance and the 2 weeks risk-adjusted cumulative performance. This approach aligns with established findings in traditional financial literature and demonstrates empirical relevance in digital assets, where price trends tend to exhibit momentum over short horizons.
Growth Factor
The growth factor captures the expansion of a protocol’s network activity and user adoption. In the context of digital assets, it reflects metrics such as fee generation and user engagement, which serve as indicators of increased platform utilization and operational scale. The factor is defined as the average z-score of 30-day fee growth and 30-day weekly active user growth, thereby identifying assets exhibiting consistent and measurable increases in underlying network usage.
Downside Beta
The downside beta factor captures an asset’s sensitivity to adverse market conditions by isolating its behavior during periods of negative market returns. Empirical evidence shows that assets with lower downside beta tend to outperform their higher-beta counterparts over the long-term, due to their reduced participation in market drawdowns and more stable return profiles during periods of elevated volatility. As such, it is estimated through a regression of the asset’s daily returns over the most recent four-week period against market returns observed exclusively during negative sessions. The resulting value is sign-inverted to ensure that assets with lower downside exposure are assigned higher z-scores.
Liquidity Factor
The liquidity factor captures the ease with which a digital asset can be traded without significantly impacting its price. Empirical evidence shows that illiquid assets tend to command a higher risk premium than their more liquid counterparts, serving as compensation for trading friction and price volatility. To quantify this, the factor is measured using token turnover, defined as trading volume as a percentage of circulating supply. The value is sign-inverted such that higher z-scores are assigned to less liquid assets.
For further detail, view the CF Factors Methodology Document, the CF Factor Data Suite, and Our paper “A Factor Model for Digital Assets” in Springer Nature’s Mathematical Research for Blockchain Economy
The information contained within is for educational and informational purposes ONLY. It is not intended nor should it be considered an invitation or inducement to buy or sell any of the underlying instruments cited including but not limited to cryptoassets, financial instruments or any instruments that reference any index provided by CF Benchmarks Ltd. This communication is not intended to persuade or incite you to buy or sell security or securities noted within. Any commentary provided is the opinion of the author and should not be considered a personalised recommendation. Please contact your financial adviser or professional before making an investment decision.
Note: Some of the underlying instruments cited within this material may be restricted to certain customer categories in certain jurisdictions.
Softer CPI Reprices July Hike Risk & Lifts Digital Assets
Digital assets extended their recovery over the past week as cooler US inflation prints repriced Fed expectations; the bid was broad across the large cap indices, growth factor leadership returned, stablecoin funding repriced lower, and stress stayed isolated in names hit by token-specific news.

Mark Pilipczuk
Notice of the Demising of CF Dai-Dollar Settlement Price and Spot Rate
The Administrator announces that it will demise the CF Dai-Dollar Settlement Price (DAIUSD_RR) and CF Dai-Dollar Spot Rate (DAIUSD_RTI) which are members of the CF Digital Asset Index Family.
CF Benchmarks
Addition of the Tether Gold Settlement Price and Spot Rate to the CF Digital Asset Index Family
The Administrator announces the addition of the Tether Gold Settlement Price and Spot Rate to the CF Digital Asset Index Family - Single Asset Series.
CF Benchmarks
By clicking Accept, you consent to CF Benchmarks's use of cookies.
Visit Cookie Settings to learn how CF Benchmarks uses cookies and to adjust your preferences.