
Mar 12, 2025
CF Benchmarks Quarterly Attribution Reports - March 2025

Executive Orders & Market Disorders
Market sentiment exhibited significant volatility throughout the most recent rebalance period. Bitcoin initially demonstrated impressive upward momentum, establishing consecutive record thresholds—first breaching $108,000 in December before pushing through $109,000 in January—fueled by an acceleration of investor demand and institutional participation amid constructive policy developments.
January delivered a pivotal regulatory breakthrough with President Trump's far-reaching executive order establishing a specialized Presidential Working Group. This coincided with the SEC's strategic policy recalibration, marked by the pivotal SAB 121 repeal and the establishment of Commissioner Peirce's dedicated Crypto Task Force. However, market conditions shifted notably in February as Bitcoin pulled back below the $80,000 threshold amid broader economic uncertainty, continued ETF outflow pressure, and a general retreat from risk assets. The substantial $1.5 billion security breach at ByBit heightened market caution, though institutional infrastructure continued its forward trajectory with CME Group's upcoming Solana futures introduction.
President Trump's national reserve and stockpile initiative, specifically targeting the five largest digital assets by market capitalization, helped bolster prices toward the end of the period. However, geopolitical and trade uncertainties placed downward pressure on the markets. Despite continued macroeconomic challenges, markets continue to reflect the accelerating institutional integration of digital assets as the regulatory landscape moves toward a more constructive framework.
Key takeaways:
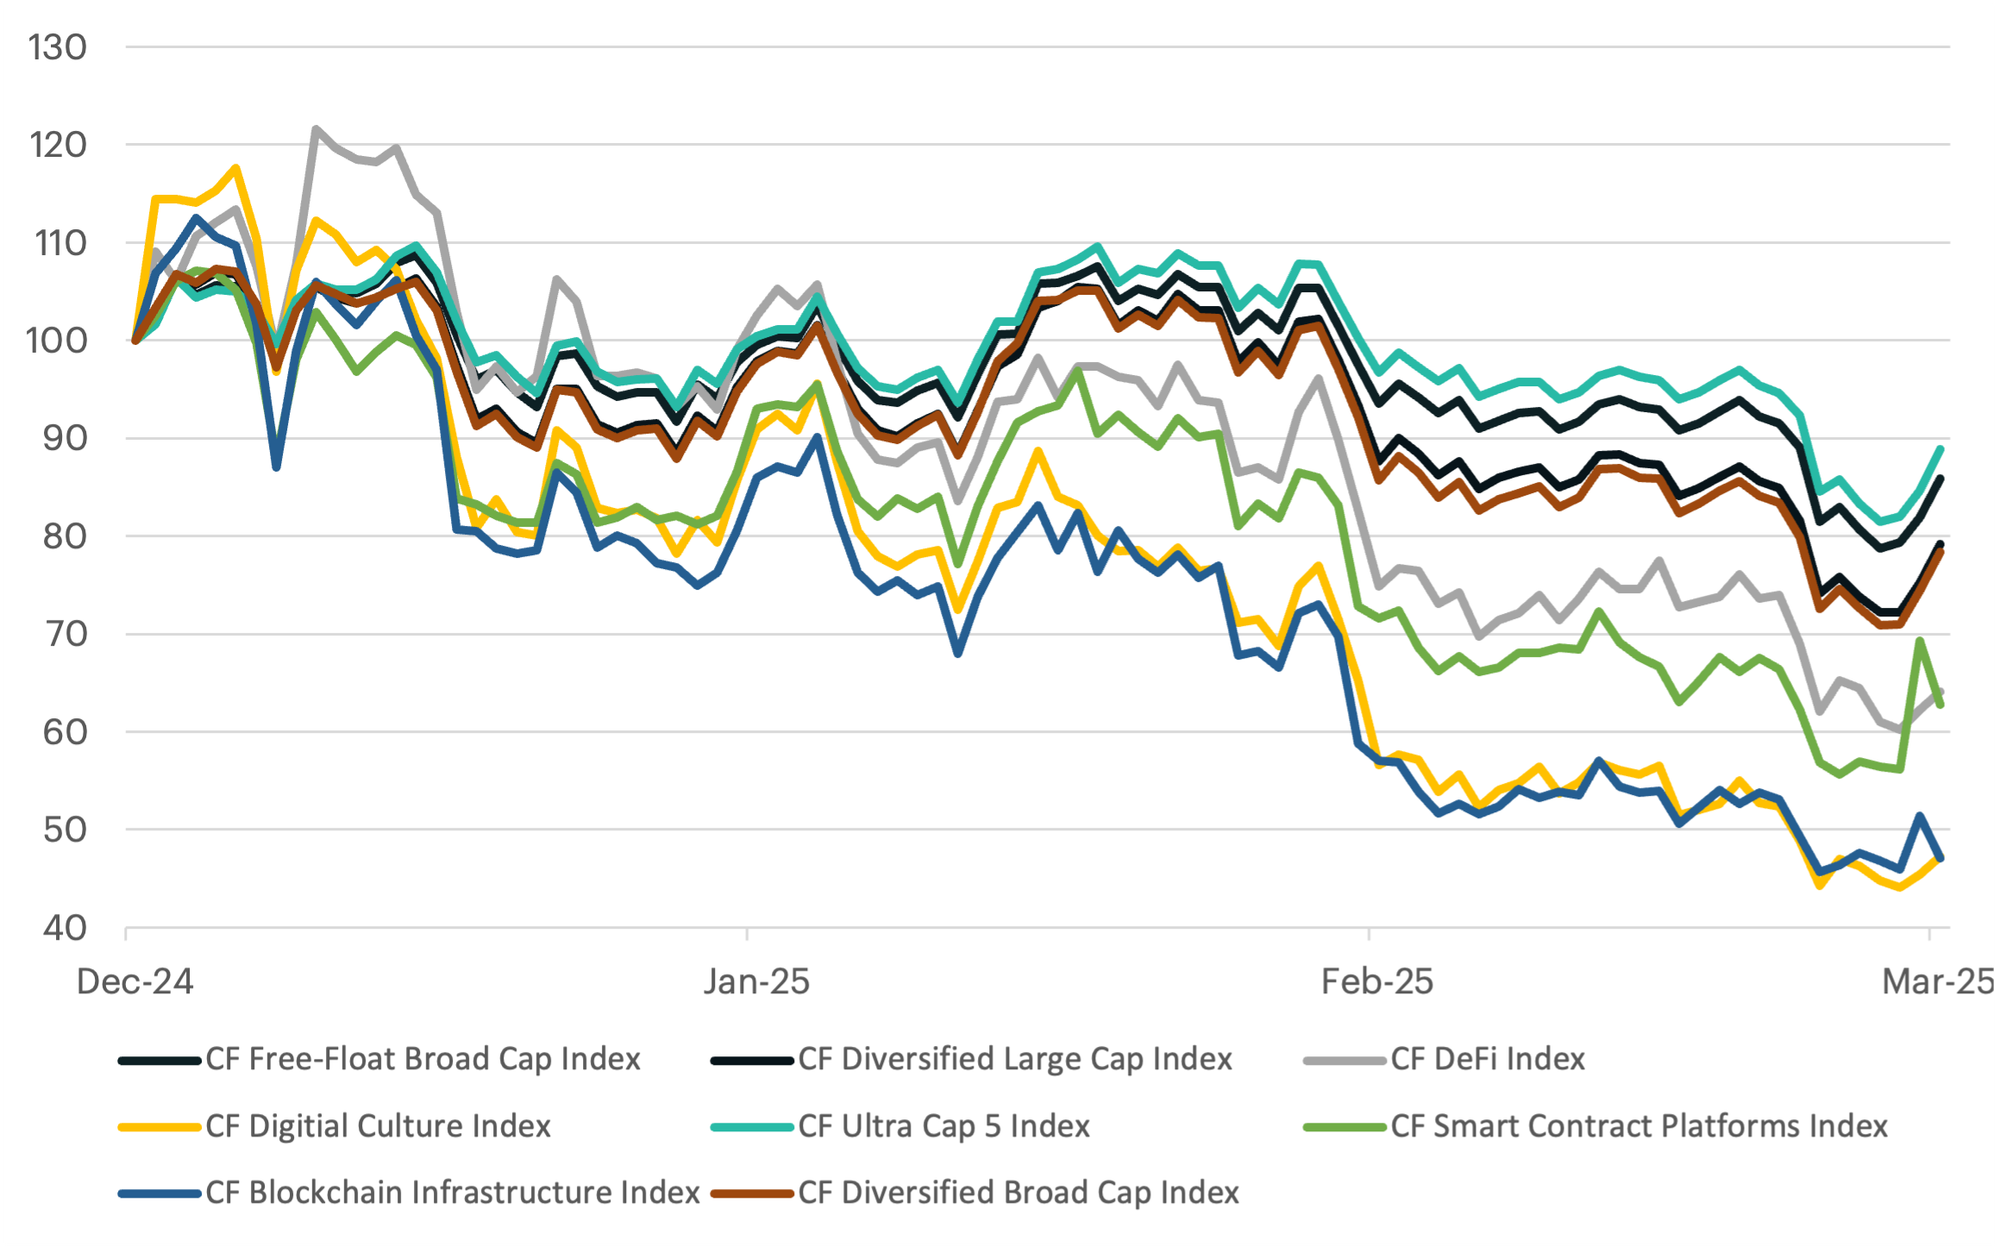
Digital Assets See Broad-Based Decline
- This convergence of macroeconomic uncertainty and regulatory tailwinds has moderated market momentum, positioning investors at a strategic inflection point that ultimately translated into subdued price performance across digital assets.
- The CF Digital Culture Index declined 52.75% and the CF Blockchain Infrastructure Index fell 50.29%, marking the steepest drops among the indices. The CF DeFi Index and CF Smart Contract Platforms Index also suffered significant losses of 35.91% and 34.08% respectively.
- The CF Diversified Large Cap Index posted a more moderate decline of 20.83%, while broader market measures showed greater resilience with the CF Free-Float Broad Cap Index losing 14.11% and the CF Ultra Cap 5 Index dropping just 11.13%. This performance pattern underscores how smaller-cap and sector-specific strategies significantly underperformed during this challenging period.
Normalized Index Performance
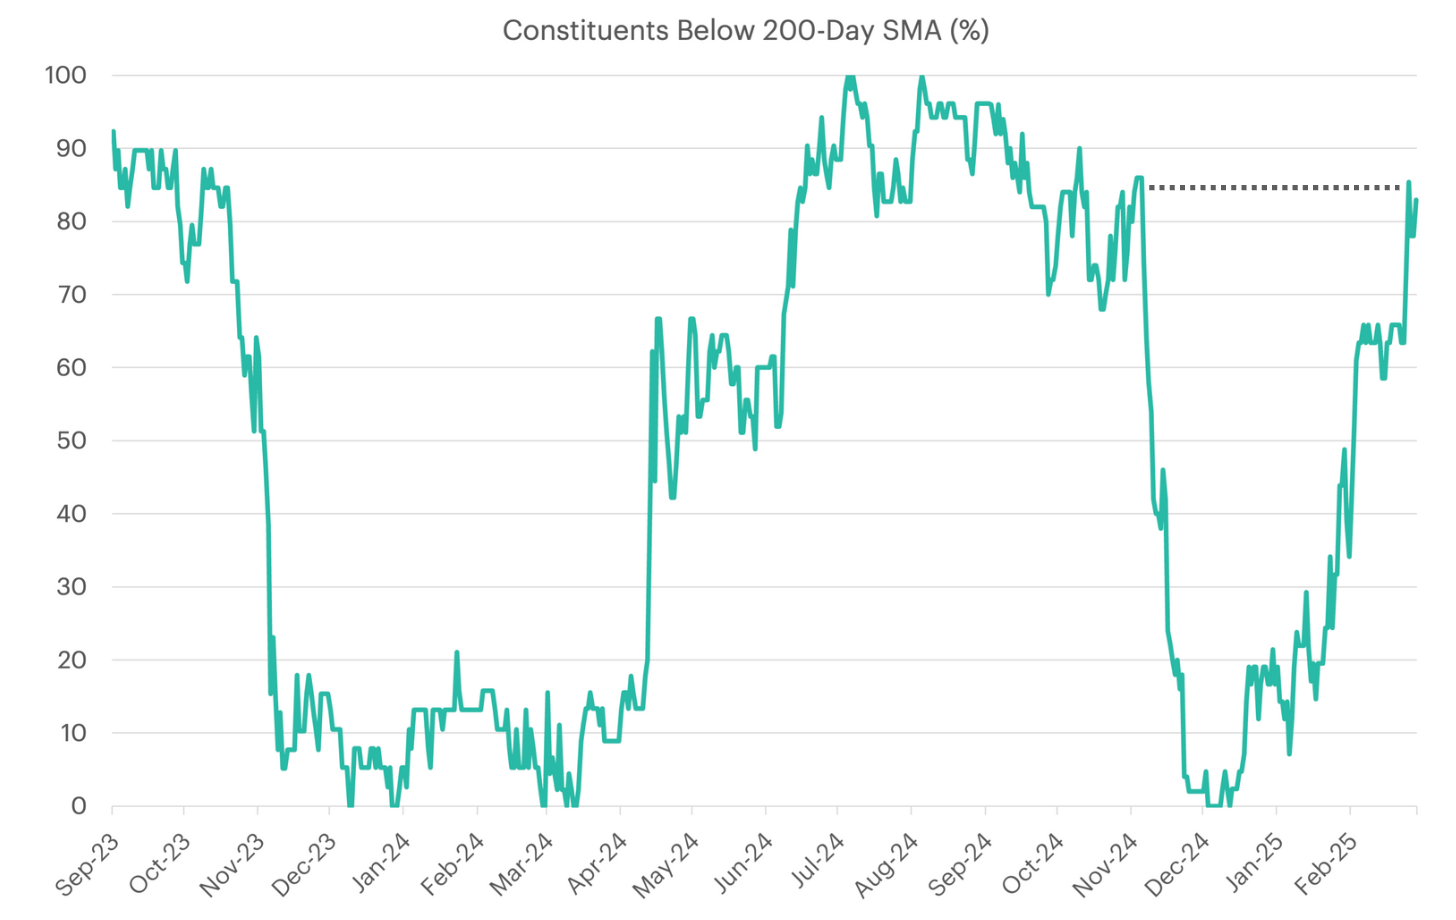
Market Breadth Retraces Back to Pre-Election Levels
Market breadth, a key technical gauge of underlying strength, has deteriorated back to pre-election levels (November 2024), with 82% of large-cap crypto constituents now trading below their 200-day simple moving average (SMA). This marks a significant reversal from the broad participation seen during the Q4 2024 rally.
While this decline signals broad-based weakness, it is not yet as severe as prior correction cycles. In mid-2024, breadth fell to 100% before rebounding sharply, fueling a sustained market recovery. The current shift—from near-zero constituents below the 200-day SMA in December 2024 to over 80% in early 2025—suggests a rapid contraction in risk appetite amid increased selling pressure.
For investors, the next inflection point will hinge on whether breadth stabilizes or continues deteriorating, as historically, recoveries have coincided with a reversal in breadth trends.
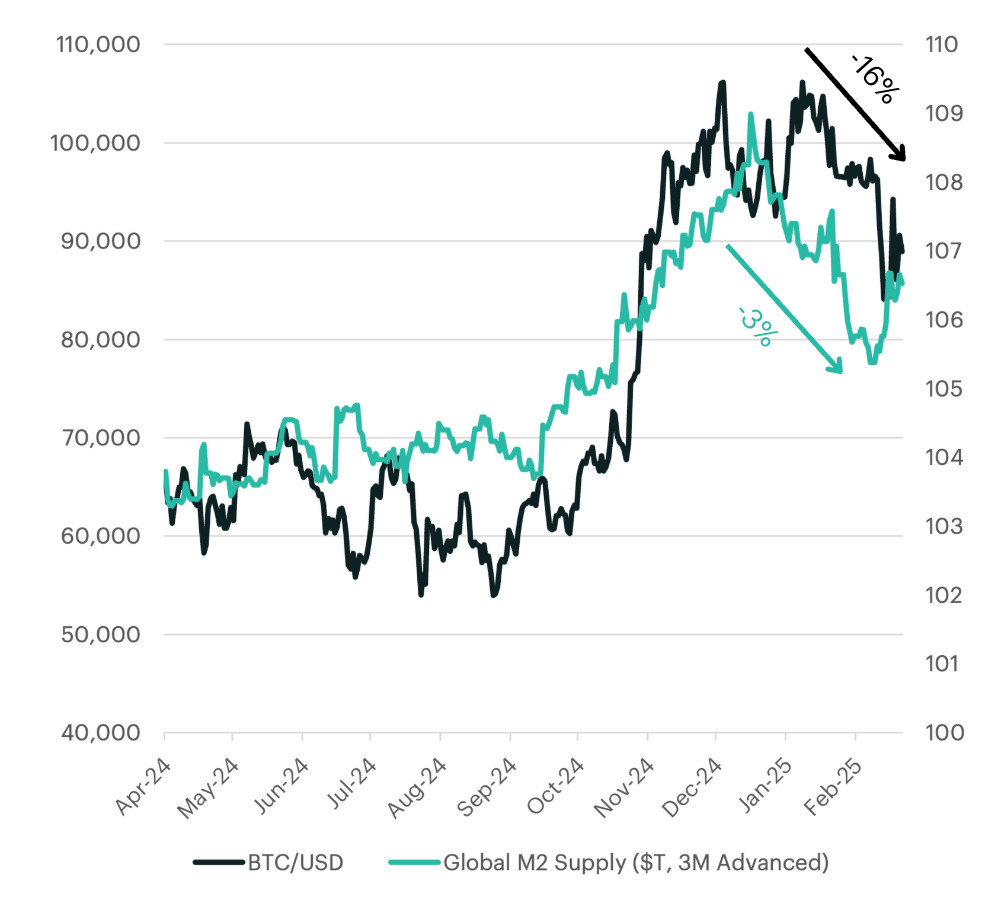
Global Liquidity Trends Halt Bitcoin Rally
Bitcoin's price performance plays a pivotal role in shaping the trajectory of the CF Ultra Cap 5 Index, given that it comprises over 70% of the index's weighting. As such, understanding some of the macroeconomic forces influencing Bitcoin is essential for investors assessing any outsized impacts that may be occurring behind the scenes.
A key driver of Bitcoin's long-term appreciation has been monetary debasement, with Bitcoin often viewed as a hedge against excessive liquidity expansion. Historically, global M2 money supply—a broad measure of liquidity—has served as a leading indicator for Bitcoin's price performance, as expansions in liquidity tend to precede rallies, while contractions correlate with market drawdowns.
The latest data reinforces this trend. Bitcoin posted an intra-day peak above $109K in mid-January 2025, coinciding with the global M2 supply reaching $107.4T three months earlier. However, as M2 liquidity started declining from its November-December highs, Bitcoin retraced, falling to $86K by early March 2025. This underscores Bitcoin's continued sensitivity to shifts in global liquidity.
The recent stabilization in M2 supply around $106.5T suggests a potential inflection point. If liquidity conditions improve, it could provide renewed tailwinds for Bitcoin, leaving us to closely monitor global M2 trends as a key indicator for Bitcoin's future price performance.
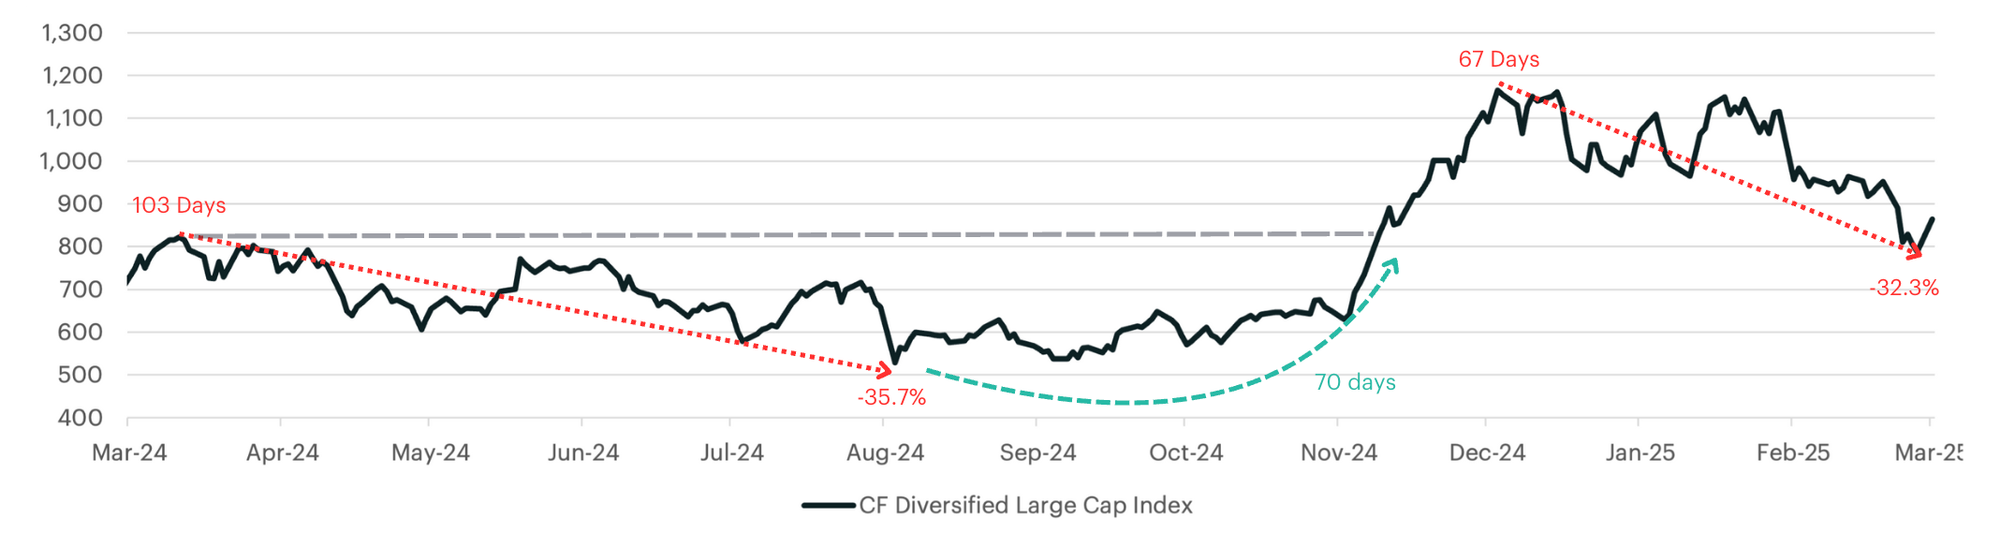
Bear Market or Just a Correction?
The CF Diversified Large Cap Crypto Index has entered correction territory, with a 30%+ drawdown from its December peak of 1,164 to 788. In equities, a correction is typically a 10% decline, while a 20% drop signals a bear market. However, large-cap cryptocurrencies are about three times more volatile than indices like the Nasdaq 100, making 30% a more fitting correction threshold and 60% a bear market marker. This adjustment reflects crypto’s higher sensitivity to macro shifts, deeper liquidity cycles, and reflexive price action, amplifying both rallies and corrections. Historically, large-cap crypto assets have seen 30–40% pullbacks within bull markets, while bear markets typically involve 60%+ declines from peak levels.
Earlier in 2024, the index experienced a 35.7% drawdown, bottoming out in August before rebounding nearly 70% over the next three months. The current correction, though similar in scale, has unfolded over a shorter time frame, indicating shifting liquidity conditions and investor sentiment. Whether this follows the previous V-shaped recovery or signals a more prolonged downturn will depend heavily on idiosyncratic catalysts, macro liquidity trends, and overall investor risk appetite.
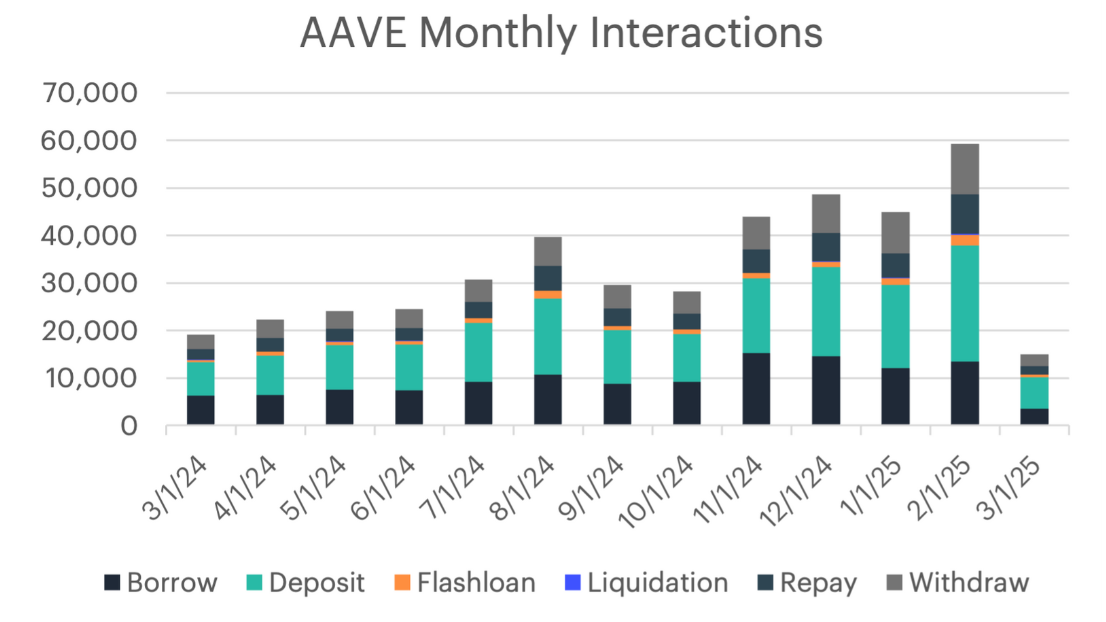
AAVE Users Look to De-Leverage During Selloff
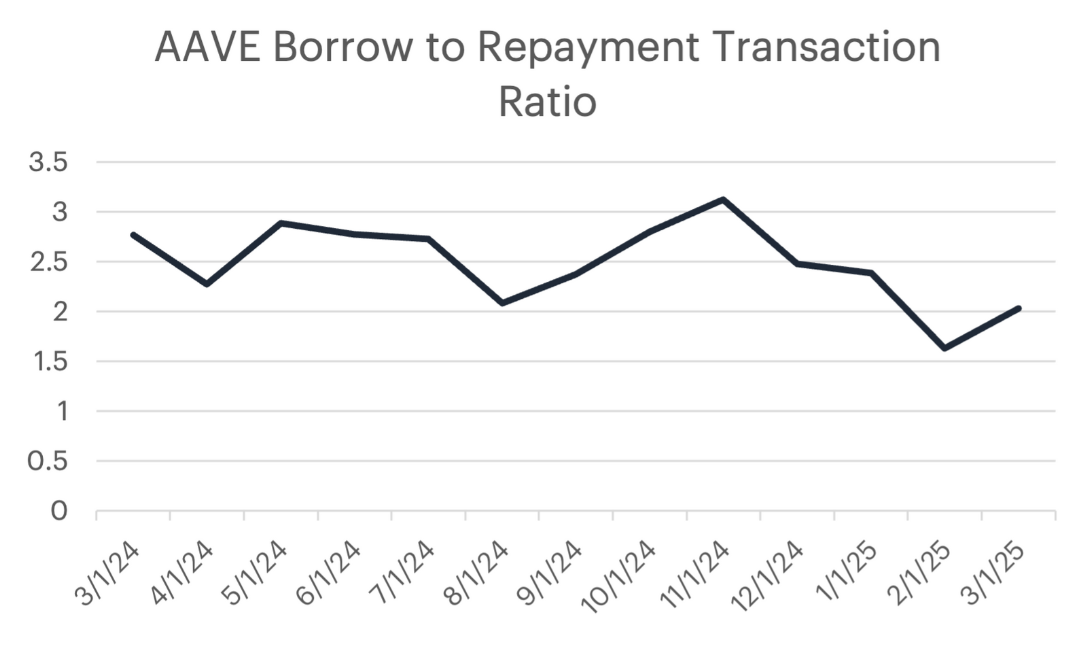
Despite recent weakness in the market, monthly interactions on Aave have seen steady growth, culminating in a remarkable 200% year-over-year increase for February. This trend underscores the protocol’s sustained growth and its appeal to a diverse range of users, from individual investors to sophisticated traders. However, the recent market sell-off has notably impacted user behavior, as evidenced by a shift toward loan repayments relative to new borrows. While the ratio of borrows to repayments averaged 2.5:1 over the last twelve months, it narrowed significantly to 1.6:1 in February.
This decline in borrowing activity could exert downward pressure on interest rates, potentially encouraging new borrowers to take advantage of lower costs. At the same time, some liquidity providers may be motivated to explore alternative platforms offering higher yields. The resulting interplay between supply and demand for capital will likely shape Aave’s near-term trajectory and influence future protocol developments.
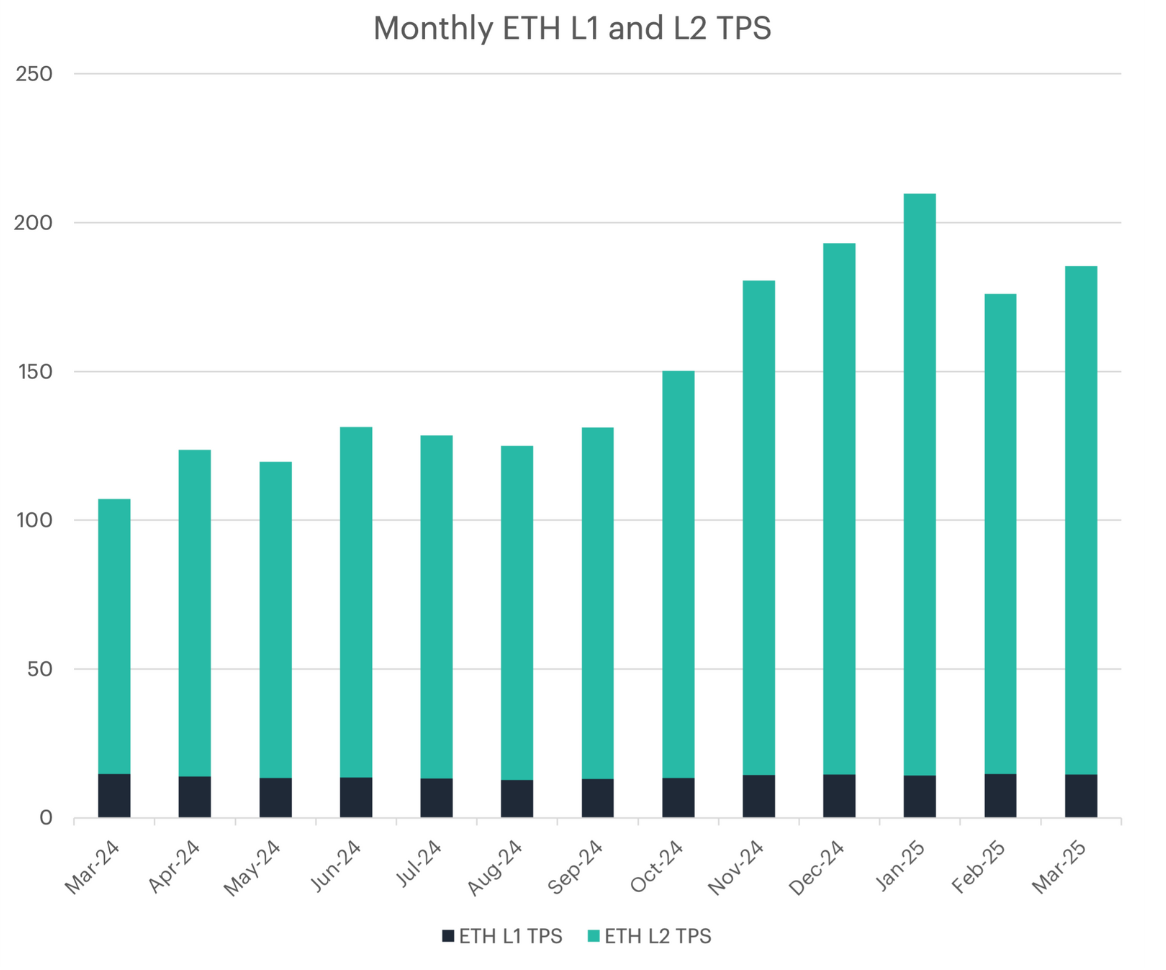
ETH Struggles as Scaling Brings Growing Pains
Ethereum has adopted a scaling strategy centered on layer-2 (L2) solutions. Over the past twelve months, combined transaction volume for Ethereum and its L2 ecosystems grew by 73%, highlighting the network’s commitment to expanding blockspace in order to maintain affordable fees. This approach, however, introduces a delicate balancing act. On one hand, increasing the total block space keeps the average fee per transaction low, thereby encouraging broader adoption of decentralized applications. On the other hand, excessively low fees can reduce the burn rate for Ether causing the supply to grow as a result of the block subsidies paid to validators.
While Ethereum’s transaction throughput has increased since late 2021, total monthly fee revenue dropped from a peak of $1.8 billion to just $64 million by February 2025. This sharp decline in revenue may help explain Ethereum’s underperformance relative to other major layer-1 tokens, with ETH falling 36% in the current quarter. The challenge lies in avoiding a scenario where fees become so minimal that they no longer support network security or change the token’s economics, potentially leading to inflationary pressures. As layer-2 adoption continues to surge, Ethereum must carefully calibrate its fee structure to remain both accessible and secure.
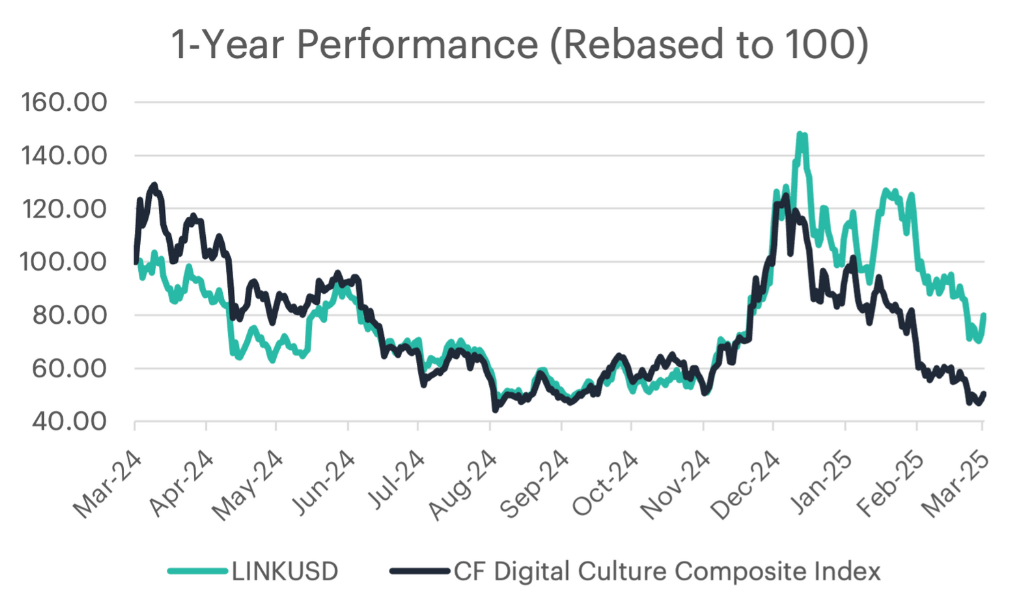
Chainlink Adoption Contributes to Outperformance
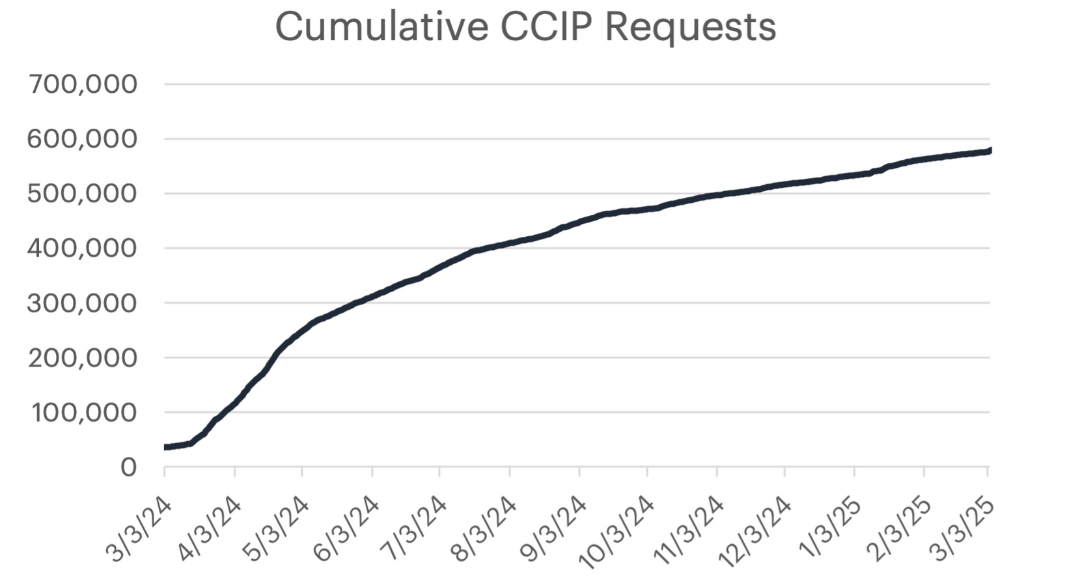
Over the past year, Chainlink (LINK) has demonstrated notable resilience, declining just 20.17% compared to the CF Digital Culture Composite Index’s 49.76% drop. This relative strength coincides with a sharp increase in the adoption of Chainlink’s Cross-Chain Interoperability Protocol (CCIP), which saw cumulative usage grow by 1503% over the same period. Increased protocol adoption often reinforces investor confidence, as demonstrated by LINK’s divergence from the broader index in the fourth quarter.
This shift aligns with a broader narrative favoring projects with tangible utility, particularly in infrastructure and interoperability solutions. Regulatory optimism has further contributed to LINK’s relative outperformance, as its enterprise partnerships and continued DeFi integrations provide a foundation for long-term adoption. As capital rotates toward established, functionally critical protocols, Chainlink’s relative strength highlighting the increasing importance of real-world usage in driving market differentiation.
Arbitrum Margins Hold up Despite Revenue Slump
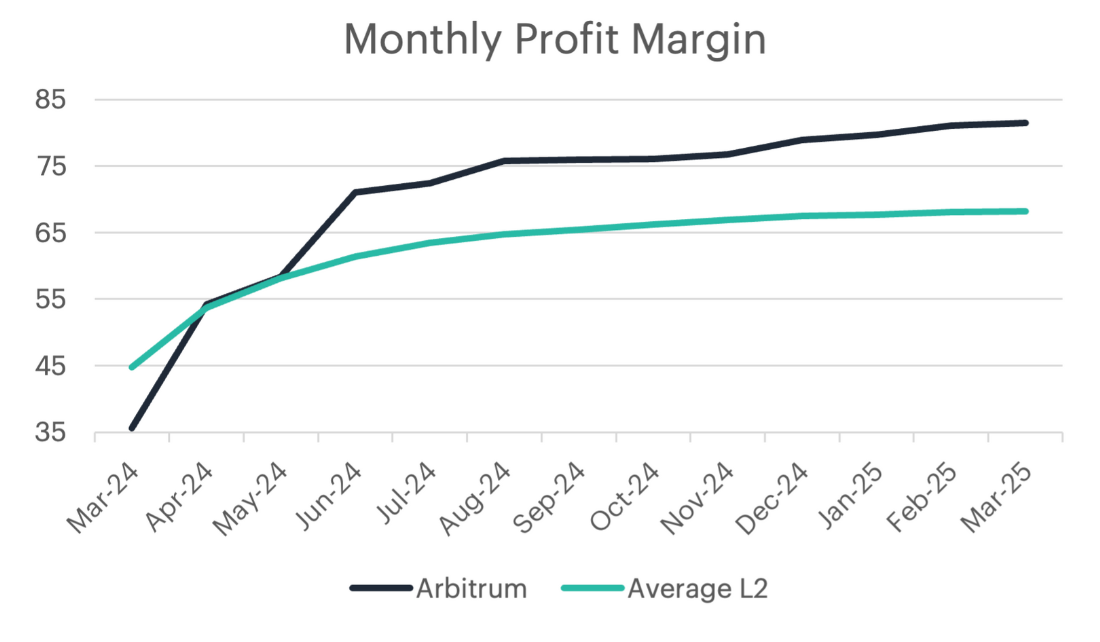
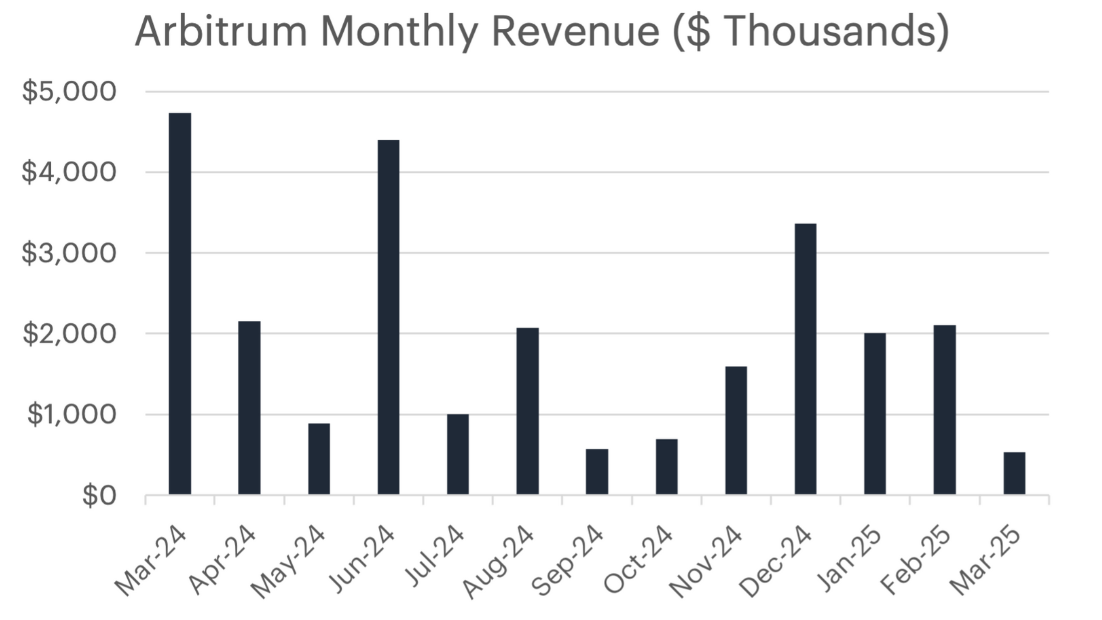
Despite a 58.11% price decline during the recent rebalance period, Arbitrum stood out as the second-best performing layer-2 protocol in the CF Blockchain Infrastructure Index, largely due to its strong underlying fundamentals. Arbitrum’s share of overall layer-2 revenue rose from 8% in March 2024 to 20.7% by February 2025, even as total layer-2 earnings declined.
A layer-2 profit margin is calculated by subtracting the costs paid to the Ethereum mainnet from the fees collected at the layer-2 level, providing a measure of operational efficiency. Over the past year, Arbitrum has significantly improved in this regard, with its monthly profit margin increasing from 35% in March 2024 (compared to an industry average of 44.7%) to 81.5% in February 2025 (versus an average of 68.1%). This steady rise underscores Arbitrum’s ability to optimize transaction processing, reinforcing its appeal among decentralized applications seeking scalability and cost efficiency.
To read the full compilation report or a specific index's report, please click on the respective links below:
- Quarterly Attribution Report (PDF Version)
- CF Broad Cap Index Series
- CF Cryptocurrency Ultra Cap 5 Index
- CF Diversified Large Cap Index
- CF DeFi Composite Index
- CF Web 3.0 Smart Contract Platforms Index
- CF Digital Culture Composite Index
- CF Blockchain Infrastructure Index
Lastly, our Quarterly Attribution Reports are designed to help investors understand the performance of digital assets through a purpose-centric lens called the CF Digital Asset Classification Structure (CF DACS). To learn more about CF DACS, please utilize our interactive CF DACS Token Explorer.
Contact Us
Have a question or would like to chat? If so, please drop us a line to:
The information contained within is for educational and informational purposes ONLY. It is not intended nor should it be considered an invitation or inducement to buy or sell any of the underlying instruments cited including but not limited to cryptoassets, financial instruments or any instruments that reference any index provided by CF Benchmarks Ltd. This communication is not intended to persuade or incite you to buy or sell security or securities noted within. Any commentary provided is the opinion of the author and should not be considered a personalised recommendation. Please contact your financial adviser or professional before making an investment decision.
Note: Some of the underlying instruments cited within this material may be restricted to certain customer categories in certain jurisdictions.
Changes to the Token Market Price Benchmarks Series - Market Prices – 21 July 2026
The Administrator has confirmed changes to the Token Market Price Family for the period 14 July 2026 to 21 July 2026.

CF Benchmarks
Softer CPI Reprices July Hike Risk & Lifts Digital Assets
Digital assets extended their recovery over the past week as cooler US inflation prints repriced Fed expectations; the bid was broad across the large cap indices, growth factor leadership returned, stablecoin funding repriced lower, and stress stayed isolated in names hit by token-specific news.
Mark Pilipczuk
Notice of the Demising of CF Dai-Dollar Settlement Price and Spot Rate
The Administrator announces that it will demise the CF Dai-Dollar Settlement Price (DAIUSD_RR) and CF Dai-Dollar Spot Rate (DAIUSD_RTI) which are members of the CF Digital Asset Index Family.
CF Benchmarks
By clicking Accept, you consent to CF Benchmarks's use of cookies.
Visit Cookie Settings to learn how CF Benchmarks uses cookies and to adjust your preferences.