
Feb 12, 2025
Bitcoin Mining Difficulty peaks... as flagged by CF Benchmarks Research
One benefit of catching the CF Benchmarks research team's Monthly and Quarterly market reviews, quarterly Outlook reports, as well as their numerous ad hoc pieces?
Better visibility on various on-chain activity metrics, and their potential impacts.
Not all data points emanate critical readings at all times, so it's quite possible to overlook a specific on-chain development that turns out to be more significant in due course than it appeared earlier.
This can certainly be the case with Bitcoin - especially if certain on-chain outputs are not 'yet front and centre' in your analysis.
Bitcoin's key metrics determining network efficiency and security, hashrate and mining difficulty (AKA network difficulty) are a case in point.
(The links above contain more detailed definitions than the ones below, if needed.)
- Hashrate: the total computational power required for mining and processing Bitcoin transactions; a free-floating variable
- Difficulty: the computational effort required to mine a new block. Adjusts programmatically every 2,016 blocks (every ~2 weeks) to ensure consistent block creation times
Well, mining difficulty is currently around all-time highs at approximately 114.7 trillion. And hashrate is also at historically elevated levels, with a 7-day moving average of 833 exahashes per second (EH/S).
As the excerpted page below shows, the recent Monthly Market Recap, by CF Benchmarks' Head of Research Gabe Selby, CFA, and Research Analyst Mark Pilipczuk, gave a clear heads-up, well ahead of network difficulty peaking.
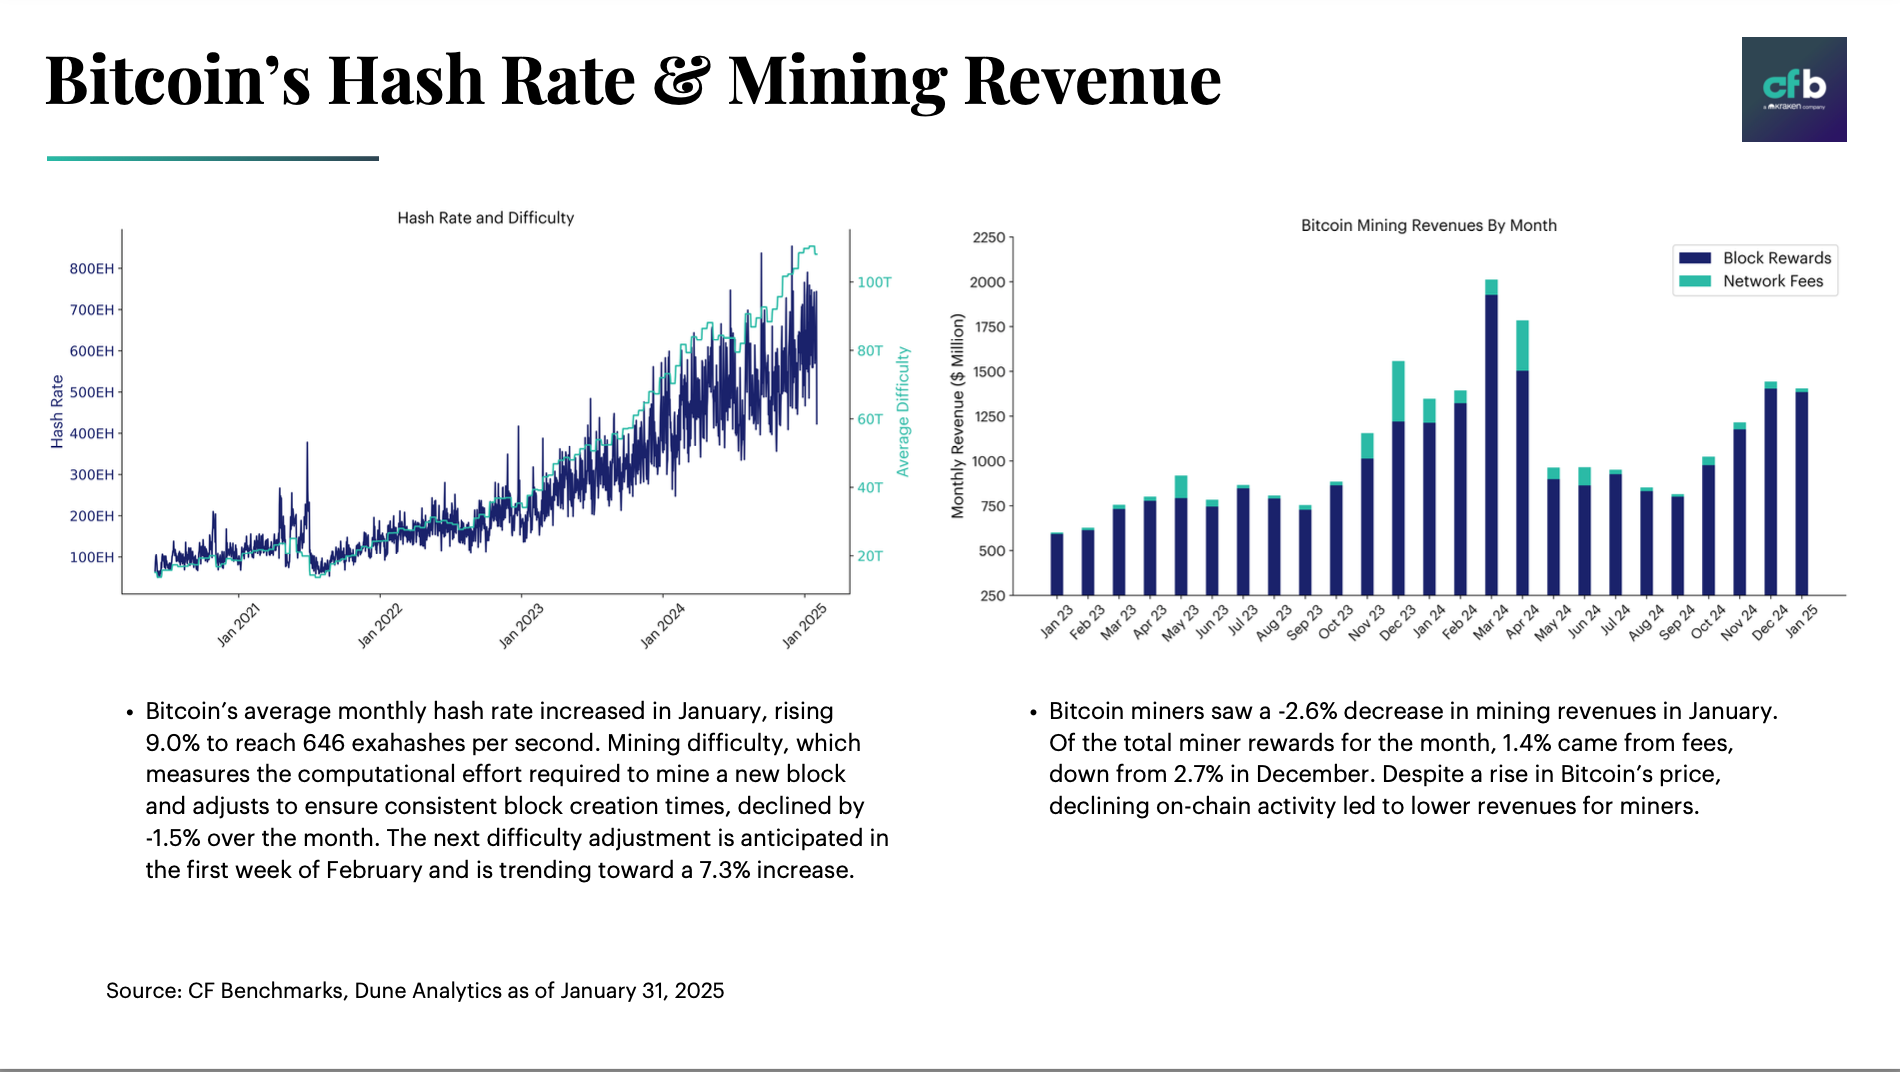
Hashrate and mining difficulty are obviously related, though their exact delta will vary over time depending on numerous other variables, including but not limited to energy costs, the price of Bitcoin at the time, as well as the perceived price outlook.
Generally though, a higher hashrate indicates miners are solving blocks faster - which tends to mechanically increase network difficulty.
When they're elevated, like now, competition for block rewards is heightened, while rewards are also reduced per miner. Efficiency gains become more critical. Miners with the most cutting edge ASICs are likely to prevail over those with less optimal hardware.
But because miners are less likely to sell Bitcoin if they expect future gains, rising difficulty and hashrate are generally considered positive - as they can signify confidence in the price outlook.
Again, as in any economy, capitulation can and does occur. Among miners, weaker players - generally smaller - will exit, perhaps permanently, if competition becomes too fierce for them.
In sum, interpreting the potential impact on the price outlook from Bitcoin's network difficulty and hashrate isn't straightforward.
But keeping up with reports from the CF Benchmarks research team is one way to be apprised of the most salient trends in those data, among other metrics, and consequently, to minimize surprises.
The information contained within is for educational and informational purposes ONLY. It is not intended nor should it be considered an invitation or inducement to buy or sell any of the underlying instruments cited including but not limited to cryptoassets, financial instruments or any instruments that reference any index provided by CF Benchmarks Ltd. This communication is not intended to persuade or incite you to buy or sell security or securities noted within. Any commentary provided is the opinion of the author and should not be considered a personalised recommendation. Please contact your financial adviser or professional before making an investment decision.
Note: Some of the underlying instruments cited within this material may be restricted to certain customer categories in certain jurisdictions.
Who Signs the Price: The CME CF Real Time Indices Through CFB Oracle
CFB Oracle delivers the CME CF Real Time Indices onchain with a CF Benchmarks signature on every value. We measure the liquidity behind the BRTI, the screens that defend it, and how administrator signing differs from Chainlink and Pyth.

Mark Pilipczuk
Digital Assets Remain Flat as Tech Sells Off
Digital assets traded mixed over the week, ending flat after a midweek rally faded with equities. Breadth improved as smaller and diversified baskets steadied while the largest names lagged, implied volatility held as realized eased, and futures basis compressed across the curve.
Mark Pilipczuk
Factor Friday - Oct 23, 2026
Size led CF Benchmarks' factor table for a fourth week at 0.75% as the Market fell 1.88% and only 4 of 35 Broad Cap tokens closed higher. Liquidity turned negative at -1.03% as more liquid assets held up better, and Size's year-to-date lead extended to 23.74%.
Mark Pilipczuk
By clicking Accept, you consent to CF Benchmarks's use of cookies.
Visit Cookie Settings to learn how CF Benchmarks uses cookies and to adjust your preferences.