
Jul 07, 2026
Bitcoin-Led Drawdown Moves the Market Lower
Monthly Attribution - June 2026
The CF Free-Float Broad Cap Index fell 18.29% in June, a decline concentrated almost entirely in its large-capitalization core rather than distributed across the tail. Settlement assets accounted for nearly the entire move, with Bitcoin and Ether together supplying roughly 85% of the loss, while the Sectors and Services categories were effectively flat at the margin. The month was defined by a single dynamic: a sustained bid withdrawal from the mega-caps that concentration-heavy benchmarks were structurally unable to dilute.
Market Recap
June opened against an inhospitable macro backdrop. May headline CPI printed +4.2% year over year as renewed US-Iran tension lifted oil, and the FOMC held its policy rate at 3.50% to 3.75%, deferring the easing that risk assets had been positioned for. With inflation reaccelerating and the growth picture unresolved, allocators had little incentive to add exposure at the top of the risk stack, and digital assets entered the month already on the back foot.
Flows did the rest. US spot Bitcoin ETFs recorded roughly $4.4 billion of outflows across a 13-day streak from May 15th to June 3rd, with BlackRock’s IBIT accounting for the largest share of redemptions. Strategy’s June 1st filing disclosed a 32 BTC sale at a $77,135 average, its first sale since December 2022 and a signal that even the most committed corporate holders were trimming. Bitcoin broke below $63,000 on June 4th amid heavy liquidations and later reached a year-to-date low near $57,800, its steepest monthly decline since June 2022. A -10.09% mining difficulty adjustment on June 13th, the second-largest reduction of 2026, underscored how far price had fallen relative to production cost.
Ether offered no offset. It returned -21.06% for the month as the Glamsterdam upgrade, after reaching final devnet in mid-June, was confirmed for Q3 2026 rather than June, removing its nearest idiosyncratic catalyst. Spot Ether ETFs shed roughly $273 million from June 17th to 29th, and the ETH/BTC ratio touched 0.02737 on June 17th, a ten-month low. With both majors selling off in tandem and liquidity thinning into month-end, the drawdown transmitted cleanly through the concentrated large-cap core that anchors the broad-cap benchmarks.
Concentration, Not Breadth, Defined the Loss
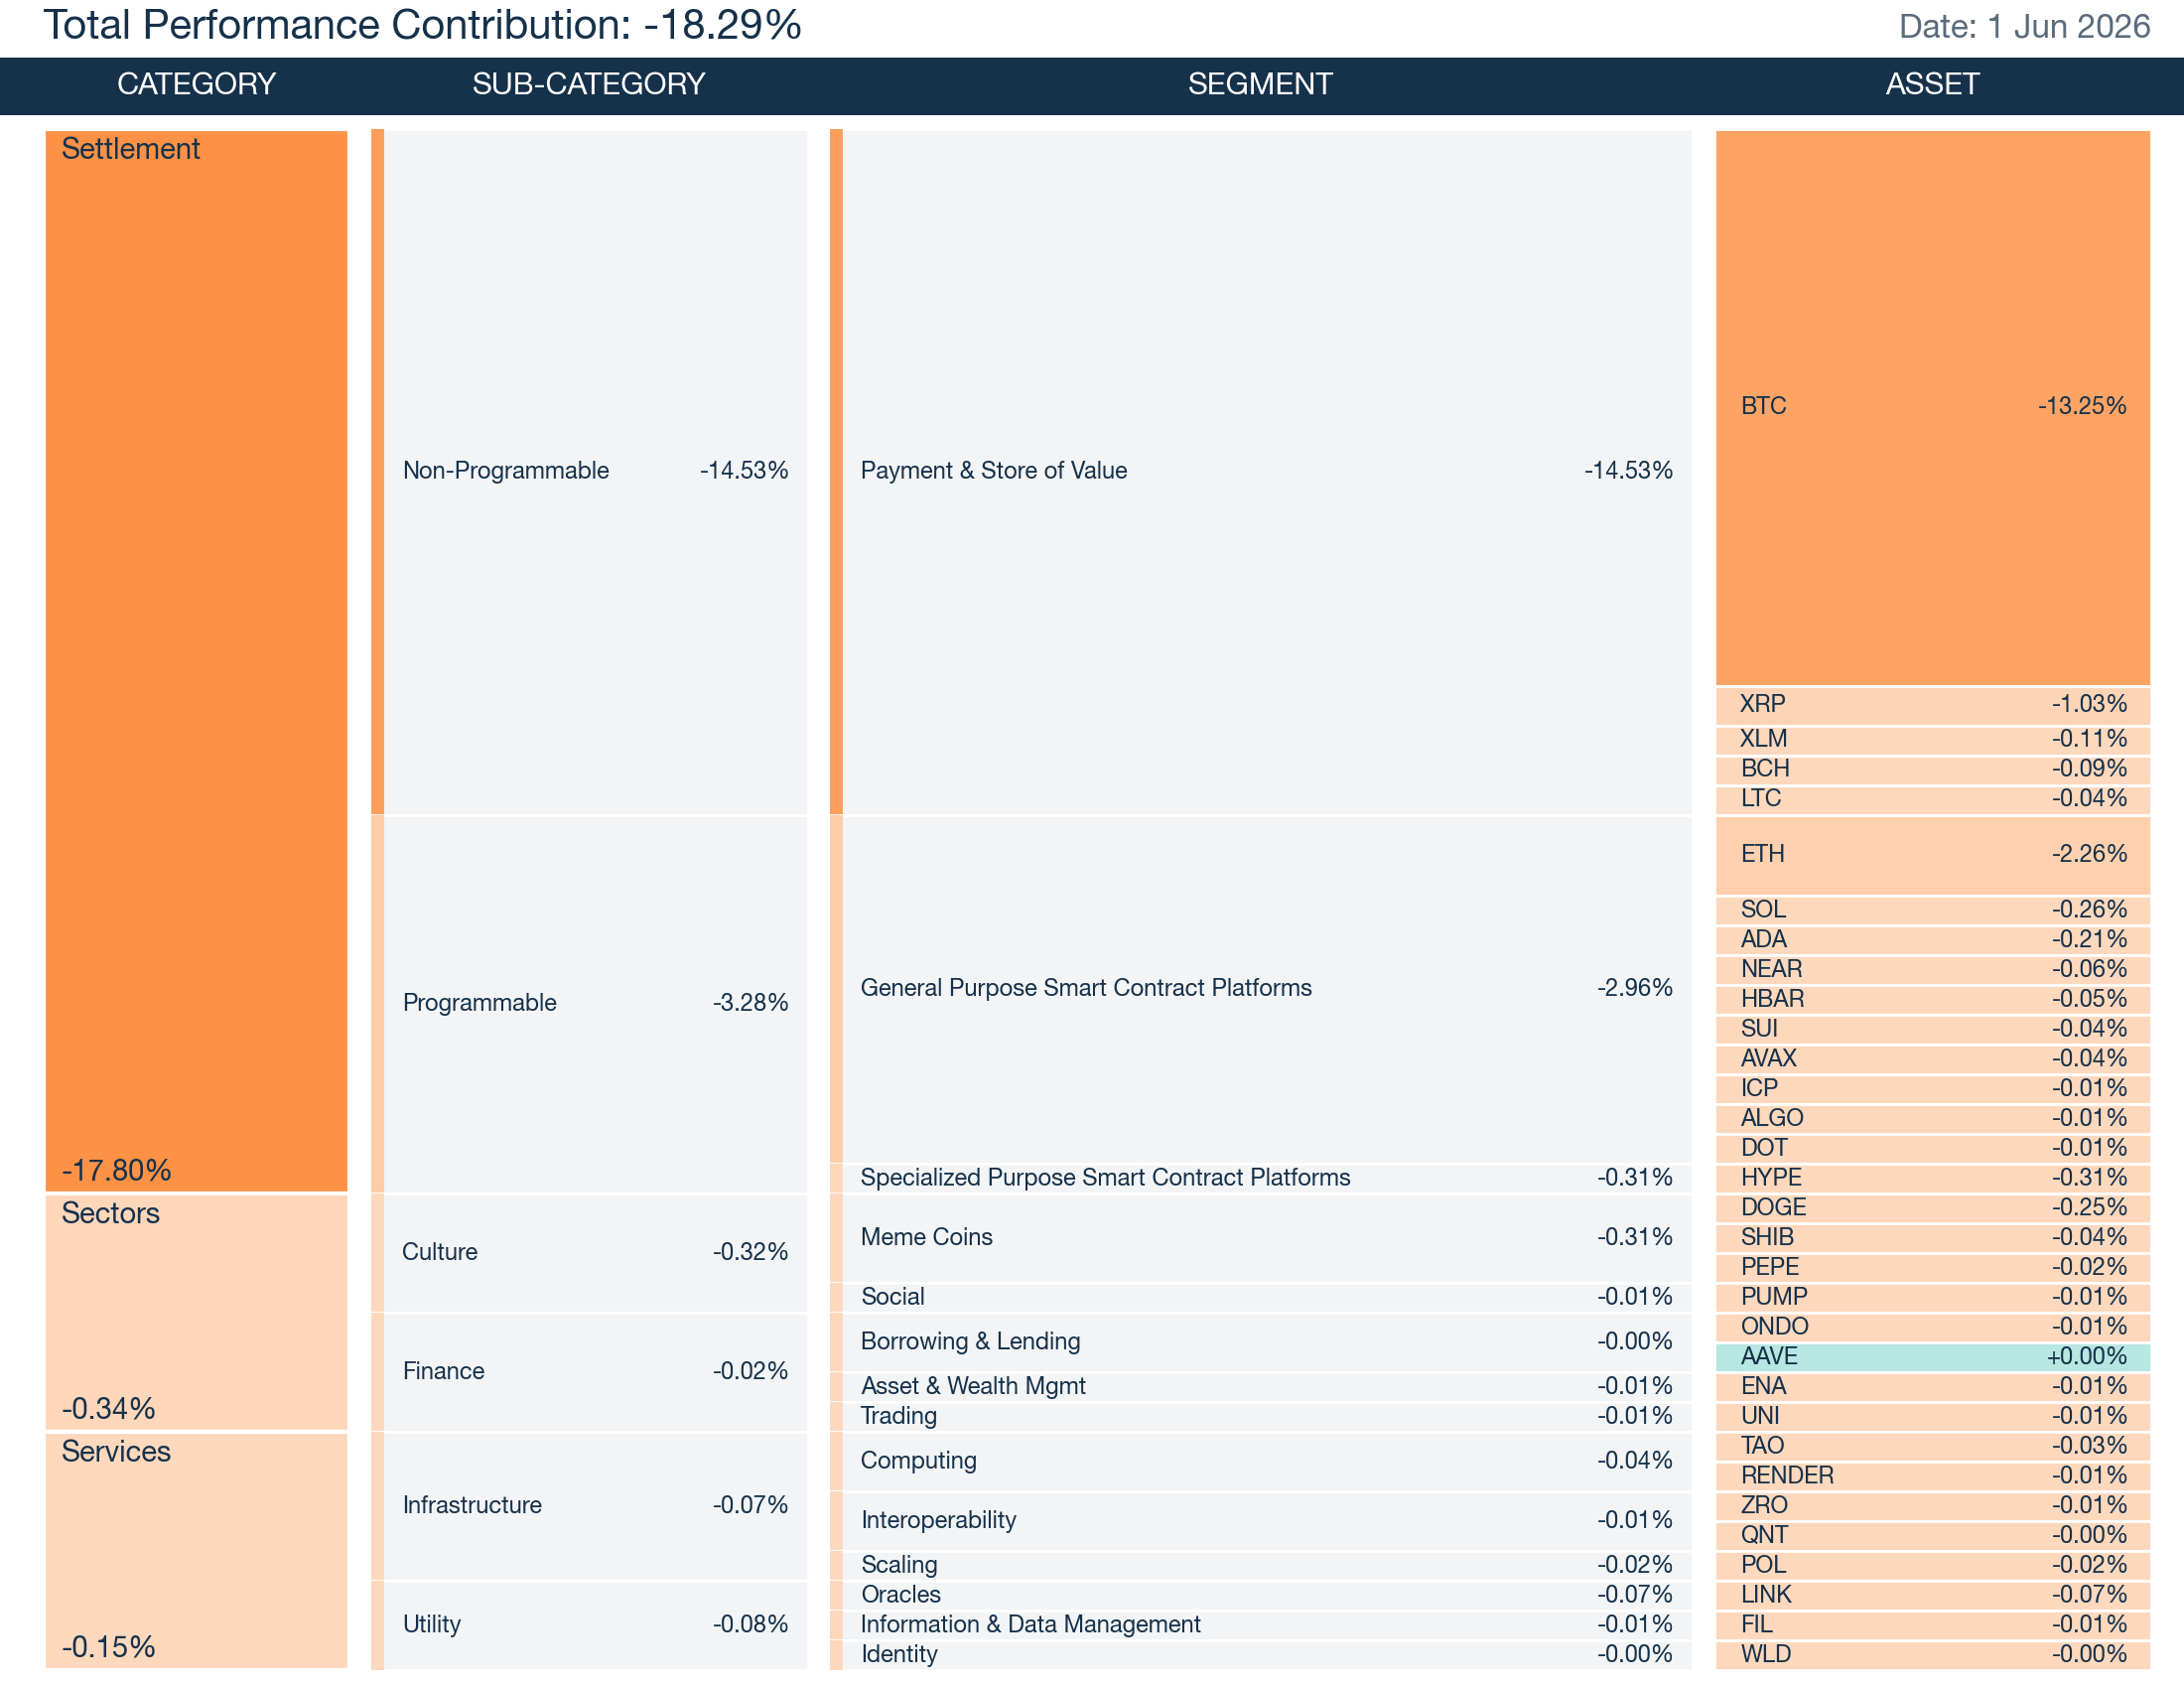
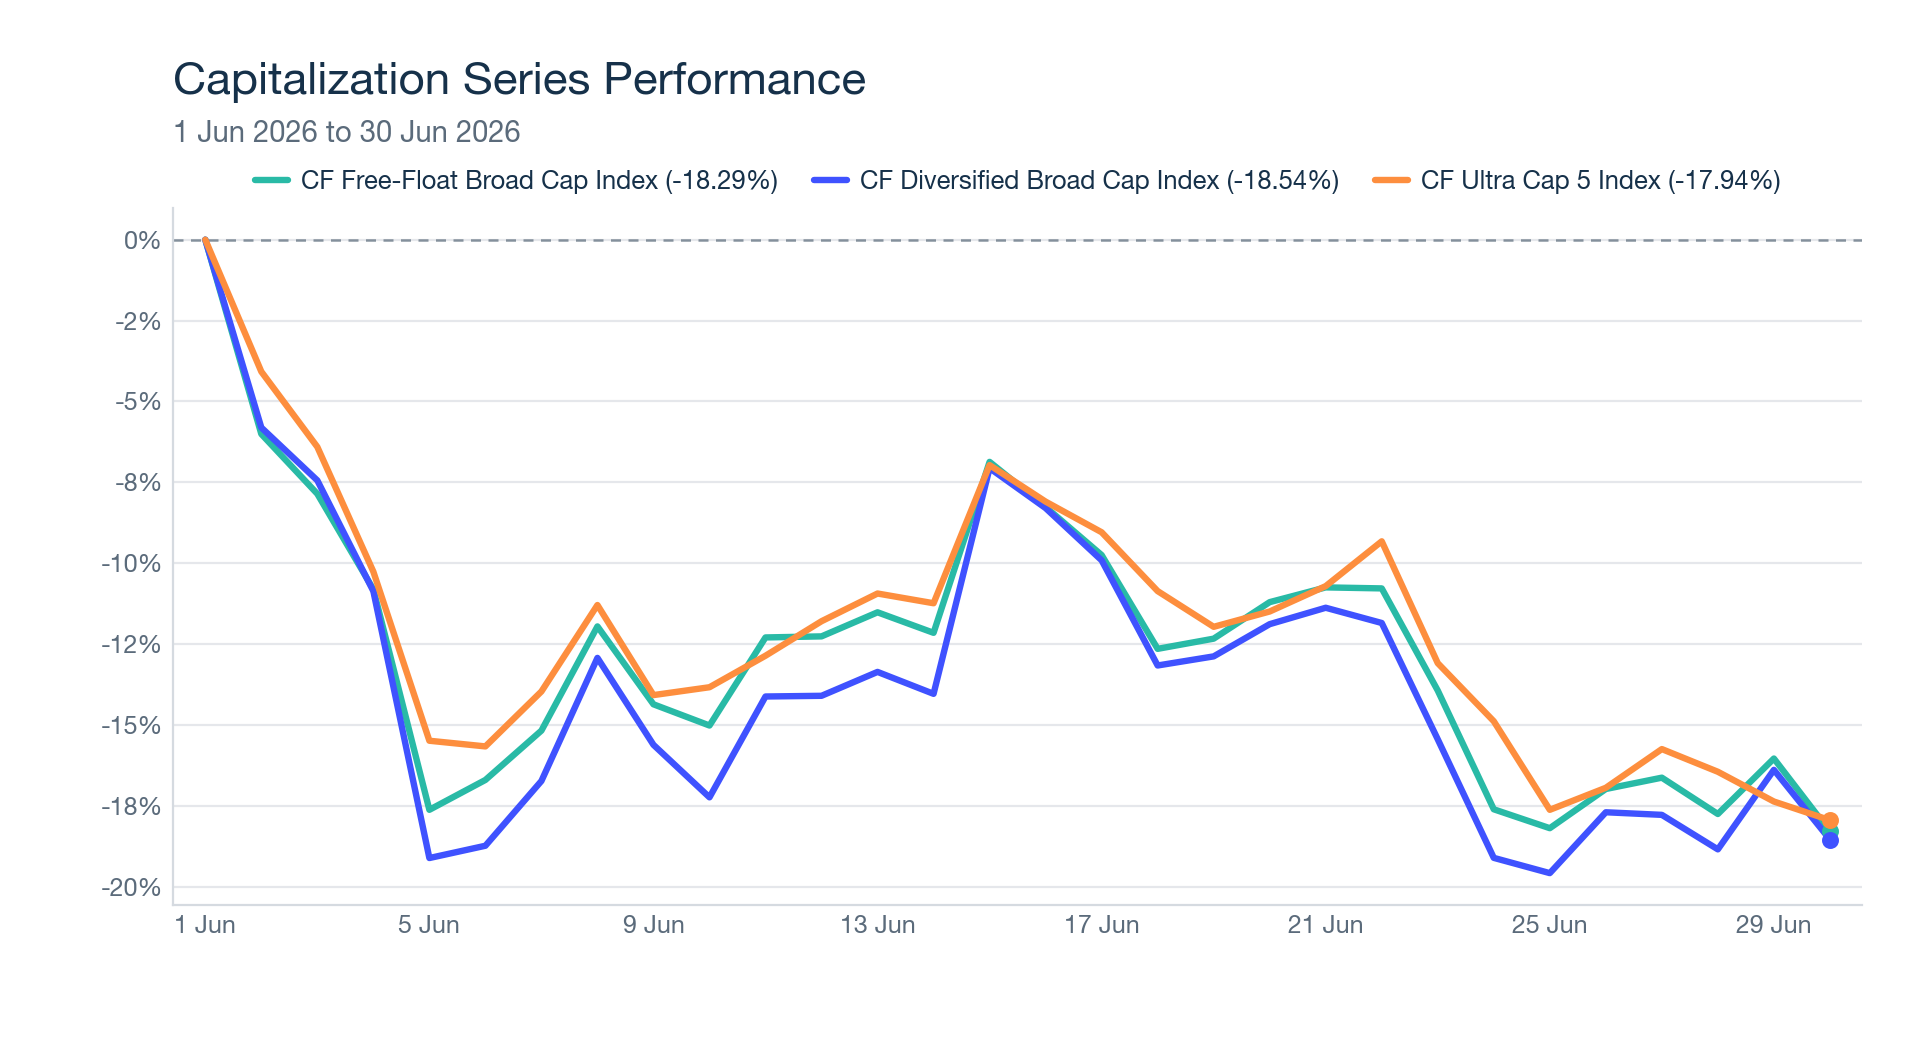
The CF Free-Float Broad Cap Index declined 18.29% over the month, with Settlement assets driving 17.80 percentage points of that move. Bitcoin alone contributed -13.25% and Ether a further -2.26%, leaving the Sectors and Services categories effectively flat and marking the weakness as a large-cap event rather than a broad market washout. That concentration was equally visible one level down: the drag sat overwhelmingly in Non-Programmable assets at -14.53%, with Programmable at -3.28% and Culture at -0.32% contributing modestly, Finance holding up best at -0.02%, and no sub-category finishing in positive territory. Dispersion across the index suite was narrow but directionally intact, as the mega-cap CF Ultra Cap 5 Index held up best at -17.94%, the CF Free-Float Broad Cap Index fell 18.29%, and the more diversified CF Diversified Broad Cap Index lagged at -18.54% because its lighter Bitcoin weight offered less of the defensiveness that BTC provided during the drawdown.
Broad Cap: Where the Return Came From
The CF Free-Float Broad Cap Index remains the clearest read on the institutional digital asset opportunity set, and June’s attribution shows just how little diversification a free-float-weighted structure provided when the majors led lower. Settlement represented 97.79% of post-rebalance weight, leaving free-float concentration in Bitcoin and Ether to carry the index almost one-for-one with the large-cap tape.
The performance contribution breakdown reinforces the point. By segment, Payment & Store of Value drove -14.53% of the return, General Purpose Smart Contract Platforms a further -2.96%, and Meme Coins -0.31%, with the entire longer tail contributing only marginally. The move was concentrated in a handful of names rather than distributed across the roughly forty-constituent basket.
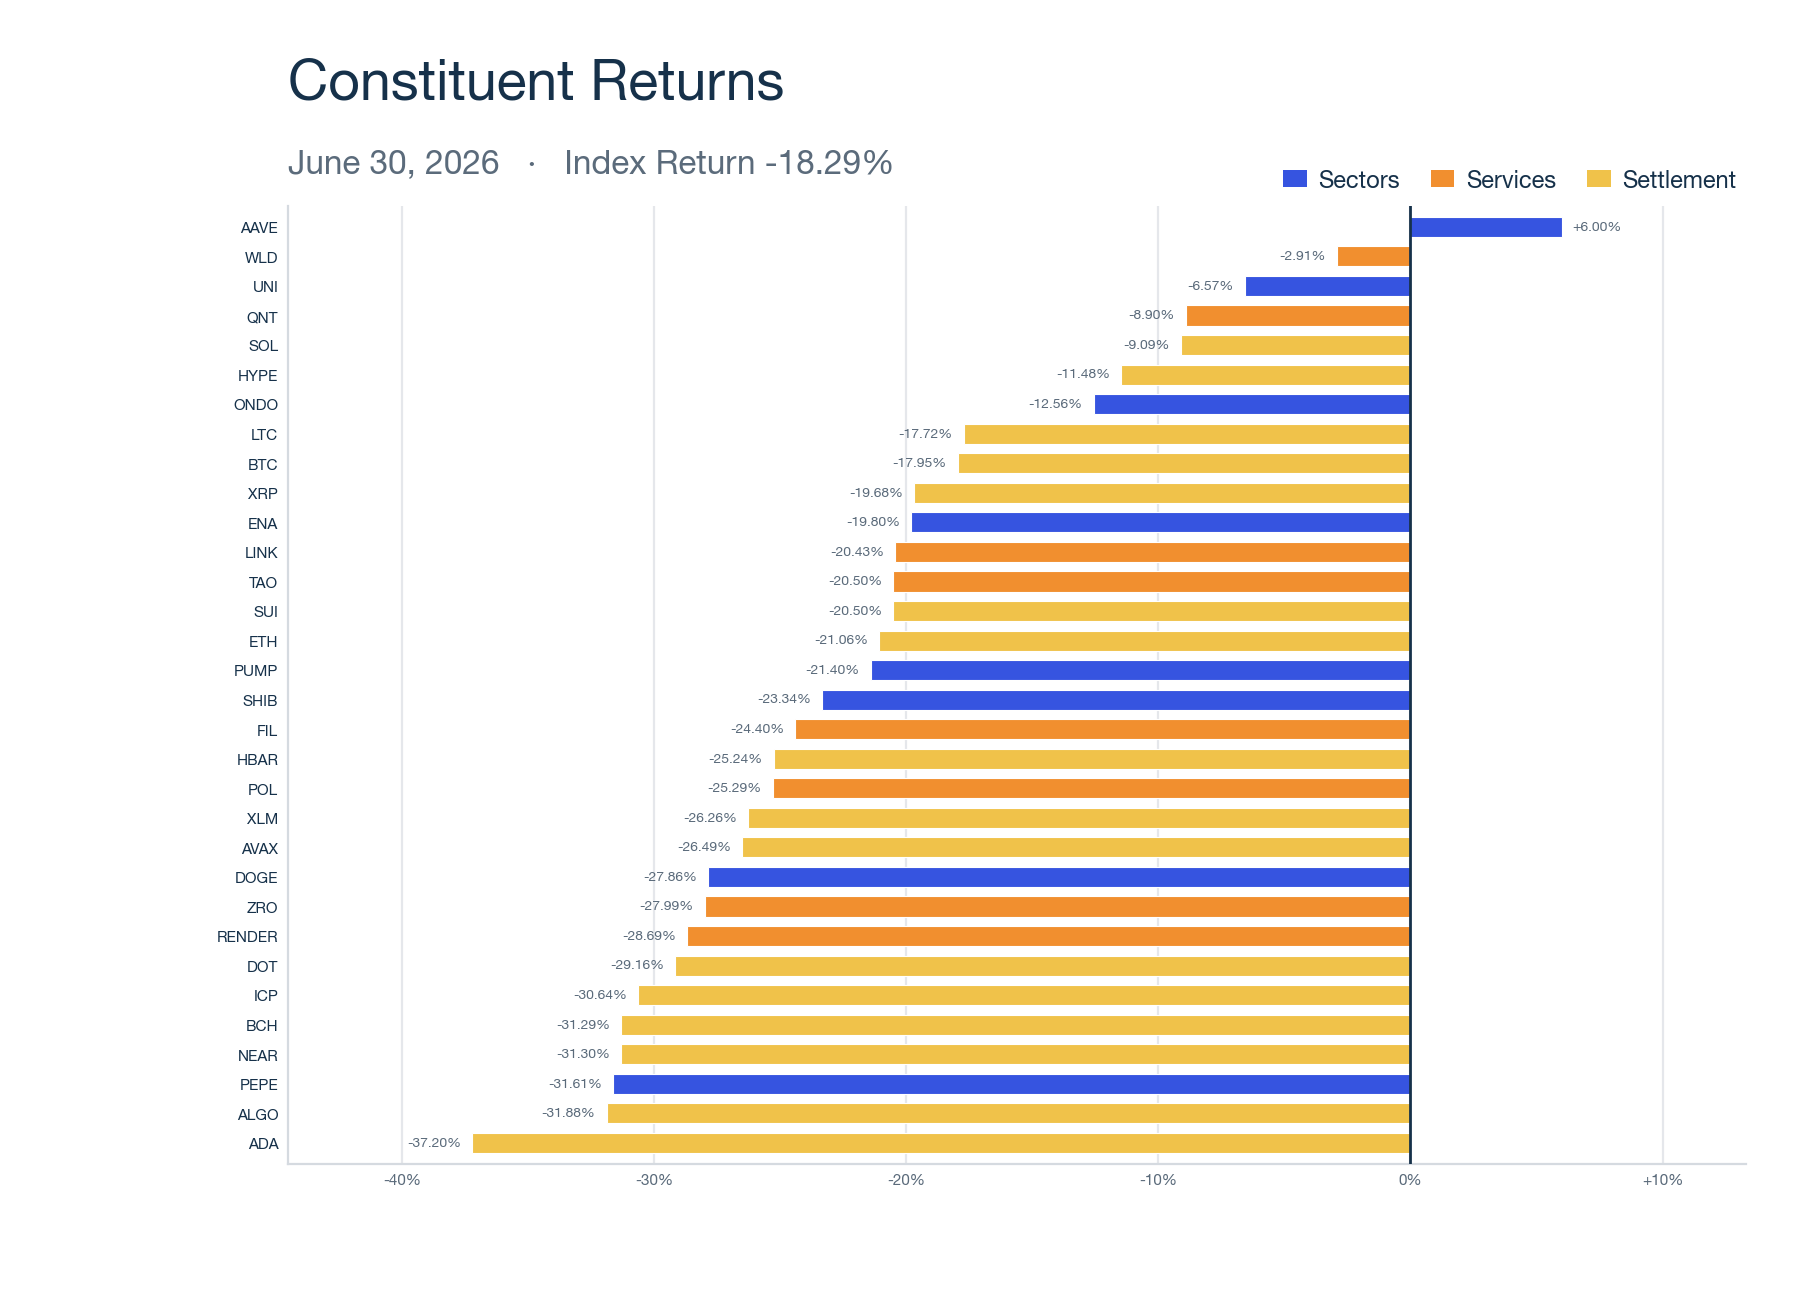
Constituent-level dispersion was wide even as the aggregate move was concentrated. AAVE led the index at +6.00%, the only meaningful positive contributor, coinciding with Standard Chartered initiating coverage on June 24th. At the other end, Cardano fell 37.20% and the higher-beta tail bore the brunt of forced de-risking, though small post-rebalance weights limited their contribution to the headline number.
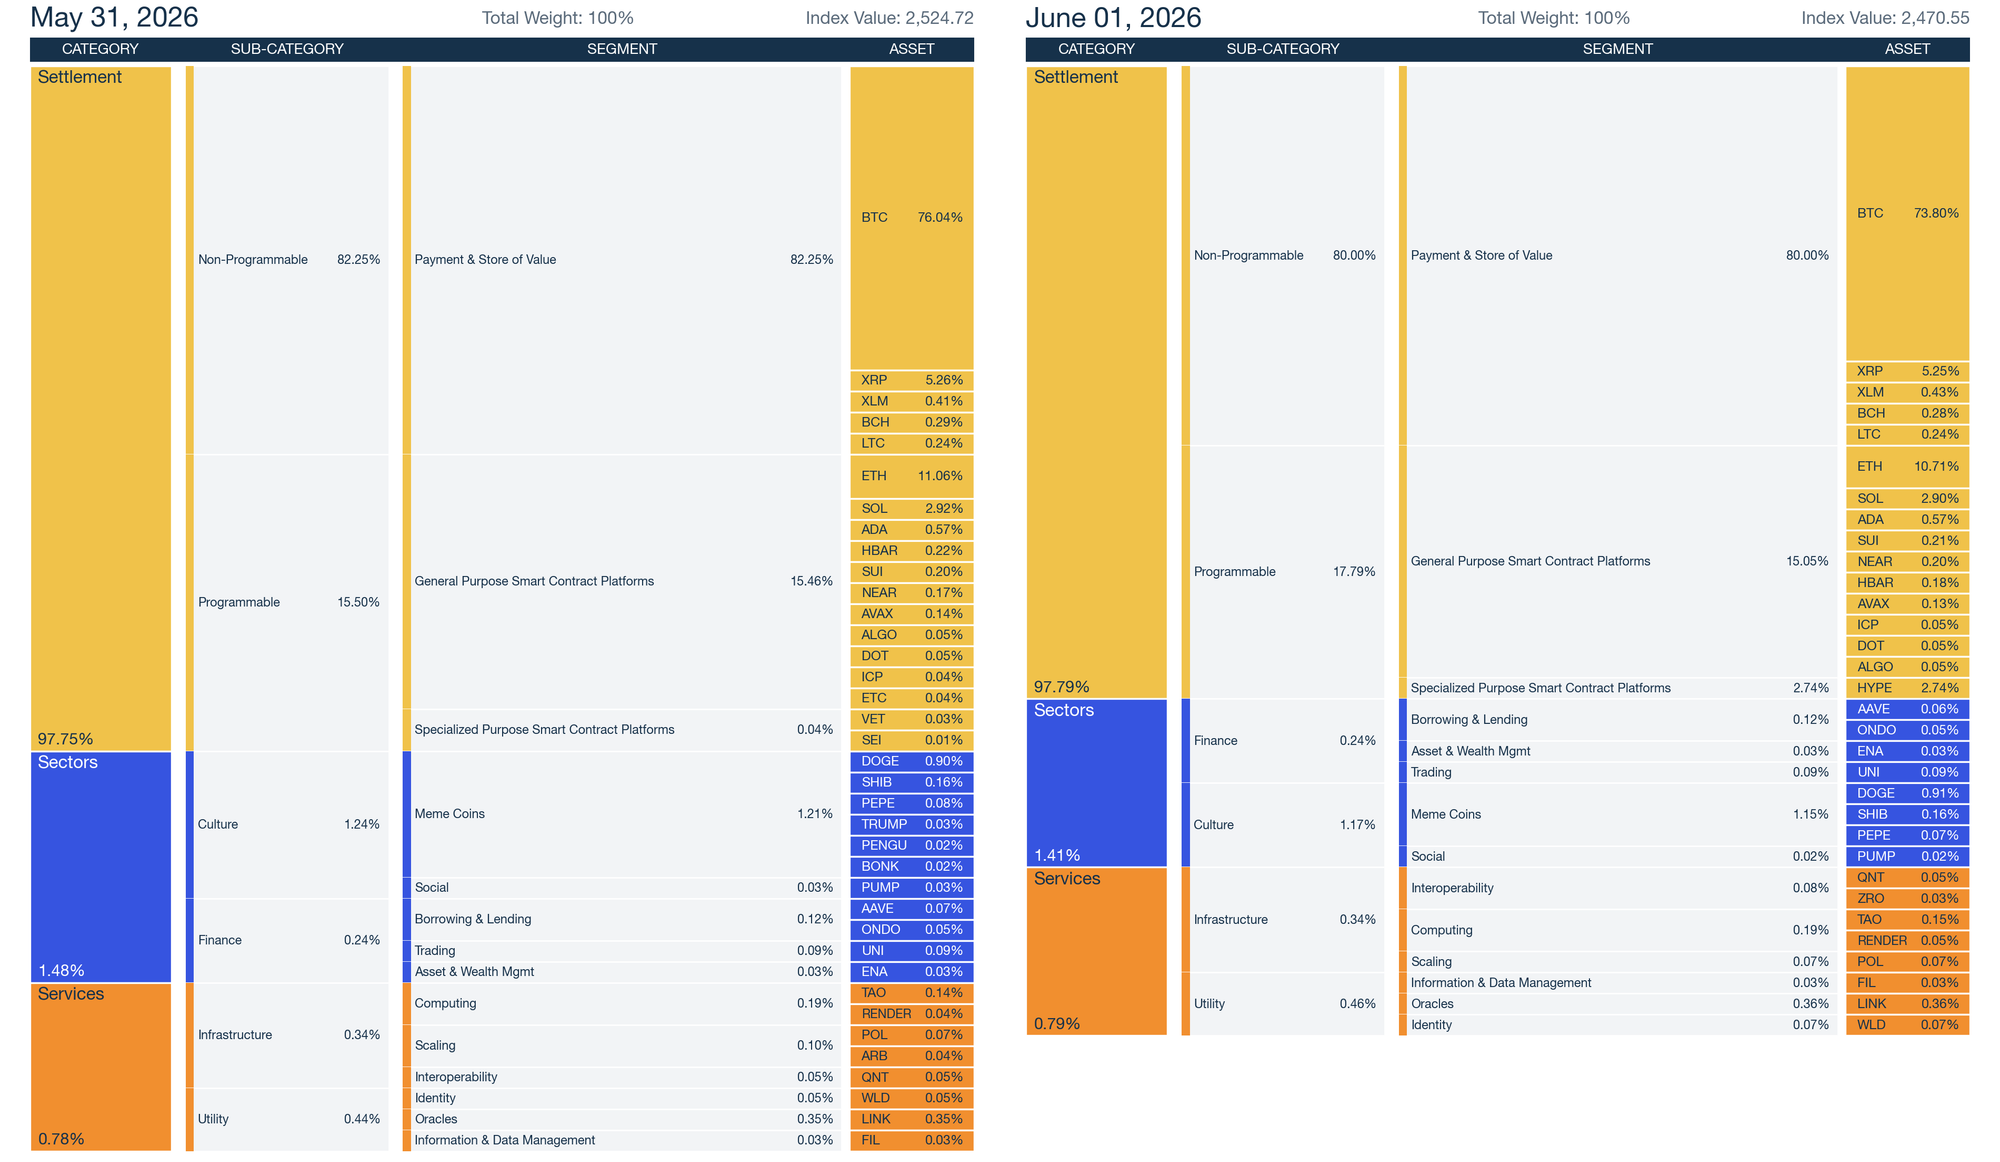
The 1 June reconstitution added Hyperliquid at a 2.74% weight, entering as the fifth-largest constituent and lifting the Specialized Purpose Smart Contract Platforms segment from 0.04% to 2.74%. Bitcoin’s weight fell roughly 2.2 percentage points to 73.80% to help fund the addition. Several small-capitalization names left the index, including ETC, ARB, VET, and TRUMP, while ZRO was added. For allocators benchmarking to the index, the post-rebalance profile carries modestly reduced Bitcoin concentration alongside a new, higher-volatility exposure through Hyperliquid.
Across the Capitalization Series
The mega-cap CF Ultra Cap 5 Index returned -17.94%, the most resilient reading in the suite. With Bitcoin at 79.39% of post-rebalance weight, the five-name basket functioned as a direct read-through of large-cap weakness: Non-Programmable assets drove -15.18% of the return, and Solana held up best among the five at -7.91% amid relative ETF-flow support. The June reconstitution left all five constituents in place with only a routine weight refresh.
The CF Diversified Broad Cap Index fell 18.54%, the widest loss of the three capitalization benchmarks. Its lighter Bitcoin allocation, which dropped below 40% for the first time following the reconstitution, reduced the defensiveness BTC provided during the drawdown, and a larger Hyperliquid weight of 7.63% added higher-beta exposure. The result illustrates the trade-off diversified structures faced this month: less single-name concentration, but also less of the large-cap ballast that cushioned the mega-cap benchmark.
Across the Classification Series
The three CF DACS category indices showed a clear defensiveness gradient. The CF Settlement Category Index declined 18.20%, the most defensive of the three, anchored by its near-total Bitcoin concentration which transmitted the drawdown almost without dilution. The CF Services Category Index fell 18.93%, led lower by its Utility sub-category, where Chainlink’s June 22nd quarterly unlock weighed on the Oracles segment. The CF Sectors Category Index was the clear laggard at -23.75%, as Meme Coins at 81.45% of post-rebalance weight amplified the broad decline and Dogecoin, at nearly two-thirds of the basket, broke below $0.07 into month-end.
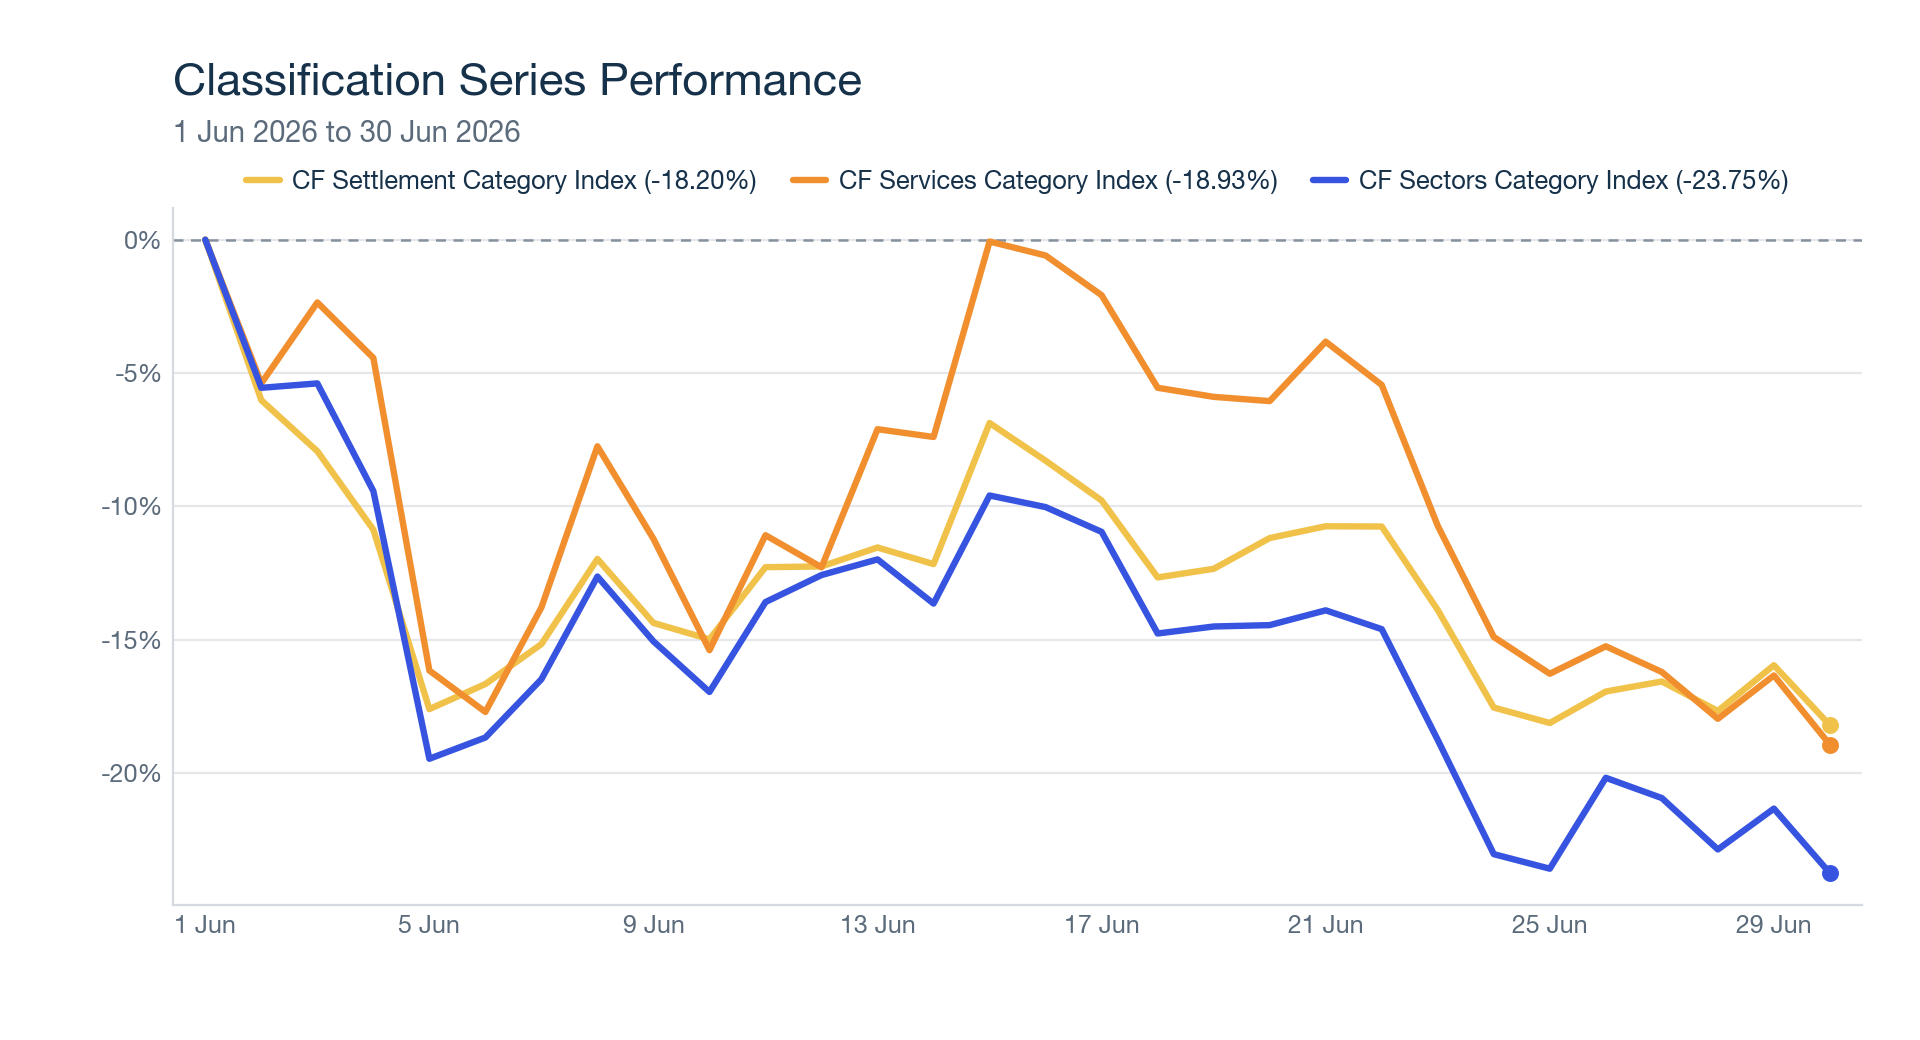
To read the full reports, please click on the respective links below:
CF Free-Float Broad Cap Index: Monthly Attribution [PDF]
CF Diversified Broad Cap Index: Monthly Attribution [PDF]
CF Ultra Cap 5 Index: Monthly Attribution [PDF]
CF Settlement Category Index: Monthly Attribution [PDF]
CF Services Category Index: Monthly Attribution [PDF]
CF Sectors Category Index: Monthly Attribution [PDF]
Our Monthly Attribution Reports are designed to help investors understand the performance of digital assets through a purpose-centric lens called the CF Digital Asset Classification Structure (CF DACS). To learn more about CF DACS, please use our interactive CF DACS Token Explorer.
The information contained within is for educational and informational purposes ONLY. It is not intended nor should it be considered an invitation or inducement to buy or sell any of the underlying instruments cited including but not limited to cryptoassets, financial instruments or any instruments that reference any index provided by CF Benchmarks Ltd. This communication is not intended to persuade or incite you to buy or sell security or securities noted within. Any commentary provided is the opinion of the author and should not be considered a personalised recommendation. Please contact your financial adviser or professional before making an investment decision.
Note: Some of the underlying instruments cited within this material may be restricted to certain customer categories in certain jurisdictions.
Launch of the CF HODLife HARD Index
The Administrator announces the launch of the CF HODLife HARD Index, a co-branded benchmark developed by CF Benchmarks and HODLife, an insurance technology company.

Mark Pilipczuk
Changes to the Token Market Price Benchmarks Series - Market Prices – 13 October 2026
The Administrator has confirmed changes to the Token Market Price Family for the period 06 October 2026 to 13 October 2026
CF Benchmarks
Notice of the Demising of Certain CF Spot Rates
The Administrator announces that it will demise the CF Storj-Dollar Spot Rate (STORJUSD_RTI) and CF Badger DAO-Dollar Spot Rate (BADGERUSD_RTI) which are members of the CF Digital Asset Index Family
CF Benchmarks
By clicking Accept, you consent to CF Benchmarks's use of cookies.
Visit Cookie Settings to learn how CF Benchmarks uses cookies and to adjust your preferences.